Display Title
Math Example: Graphs of Logarithmic Functions: Example 01
Display Title
Math Example: Graphs of Logarithmic Functions: Example 01

Topic
Logarithmic Functions
Description
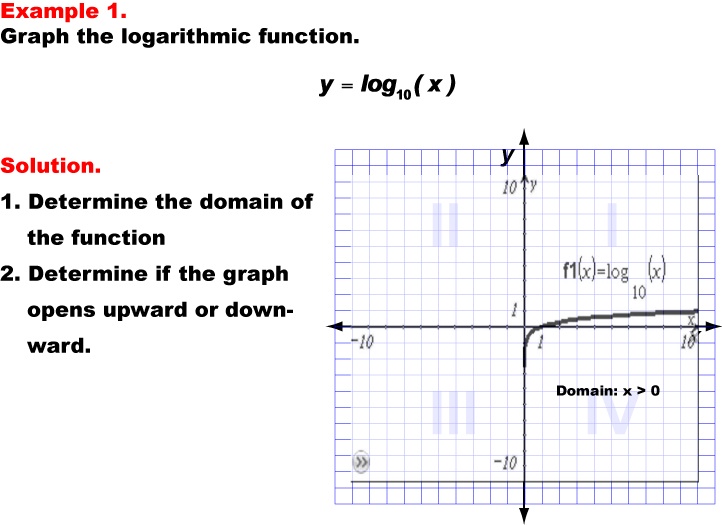
This example explores the graph of the logarithmic function y = log10(x). The graph is plotted on a grid, showing a curve that passes through the point (1,0) and increases slowly as x increases. Students are asked to determine the domain and direction of the graph.
Logarithmic functions are essential in mathematics, particularly when dealing with exponential growth or decay. They are inverse functions to exponential functions and have unique properties that make them useful in various fields, including science, engineering, and finance. This collection of examples helps teach logarithmic functions by providing visual representations of different logarithmic equations, allowing students to observe how changes in the equation affect the graph's shape and position.
Presenting multiple worked-out examples is crucial for students to fully grasp the concept of logarithmic functions. By examining various cases, students can identify patterns, understand the effects of different parameters, and develop a more comprehensive understanding of how these functions behave. This approach helps reinforce learning and enables students to apply their knowledge to new situations more effectively.
Teacher's Script: Let's look at our first example of a logarithmic function. We have y = log10(x) graphed here. Notice how the curve starts from the left and slowly rises as it moves to the right. Can you tell me where it crosses the x-axis? That's right, at (1,0). Now, think about what values of x would make sense for this function. Can x be negative or zero? Why not? This will help us determine the domain.
For a complete collection of math examples related to Logarithmic Functions click on this link: Math Examples: Graphs of Logarithmic Functions Collection.
| Common Core Standards | CCSS.MATH.CONTENT.HSF.IF.C.7, CCSS.MATH.CONTENT.HSF.IF.C.8.B, CCSS.MATH.CONTENT.HSF.BF.B.5, CCSS.MATH.CONTENT.HSF.IF.C.7.E, CCSS.Math.CONTENT.HSF.LE.A.2, CCSS.MATH.CONTENT.HSF.LE.A.3, CCSS.MATH.CONTENT.HSF.LE.A.4, CCSS.MATH.CONTENT.HSF.LE.B.5 |
|---|---|
| Grade Range | 9 - 12 |
| Curriculum Nodes |
Algebra • Exponential and Logarithmic Functions • Graphs of Exponential and Logarithmic Functions |
| Copyright Year | 2013 |
| Keywords | logarithmic functions, graphs |