Display Title
Math Example: Graphs of Logarithmic Functions: Example 02
Display Title
Math Example: Graphs of Logarithmic Functions: Example 02

Topic
Logarithmic Functions
Description
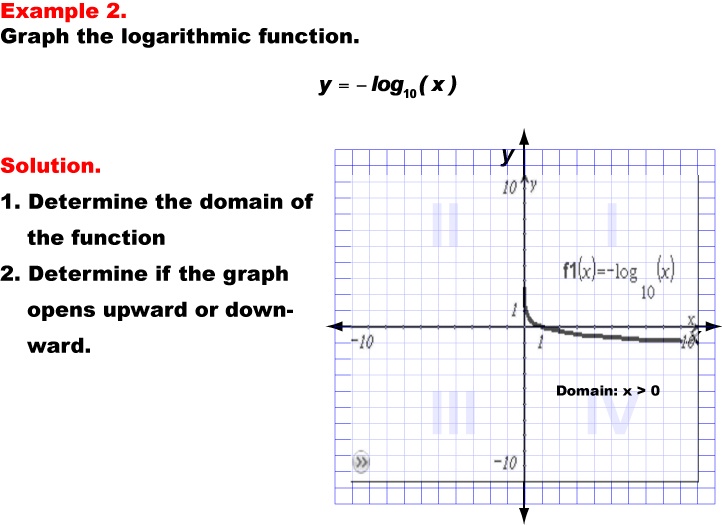
This example presents the graph of the logarithmic function y = -log10(x). The graph is a reflection of y = log10(x) over the x-axis, demonstrating how the negative sign affects the function's behavior. Students are tasked with determining the domain and direction of this graph.
Understanding logarithmic functions is crucial in mathematics, as they are widely used in various fields such as physics, chemistry, and economics. This collection of examples helps teach logarithmic functions by showcasing different variations and transformations of logarithmic equations. By comparing and contrasting these examples, students can develop a deeper understanding of how changes in the equation impact the graph's appearance and properties.
Providing multiple worked-out examples is essential for students to fully comprehend logarithmic functions. Each example builds upon the previous one, allowing students to recognize patterns and relationships between different forms of logarithmic equations. This approach helps reinforce key concepts and enables students to apply their knowledge to more complex problems and real-world situations.
Teacher's Script: Now, let's examine our second example, y = -log10(x). Compare this graph to the previous one. What's the main difference you notice? That's right, it's flipped upside down. Why do you think this happened? Consider the effect of the negative sign in front of the logarithm. How does this change affect the domain of the function? Is it different from the previous example? Why or why not?
For a complete collection of math examples related to Logarithmic Functions click on this link: Math Examples: Graphs of Logarithmic Functions Collection.
| Common Core Standards | CCSS.MATH.CONTENT.HSF.IF.C.7, CCSS.MATH.CONTENT.HSF.IF.C.8.B, CCSS.MATH.CONTENT.HSF.BF.B.5, CCSS.MATH.CONTENT.HSF.IF.C.7.E, CCSS.Math.CONTENT.HSF.LE.A.2, CCSS.MATH.CONTENT.HSF.LE.A.3, CCSS.MATH.CONTENT.HSF.LE.A.4, CCSS.MATH.CONTENT.HSF.LE.B.5 |
|---|---|
| Grade Range | 9 - 12 |
| Curriculum Nodes |
Algebra • Exponential and Logarithmic Functions • Graphs of Exponential and Logarithmic Functions |
| Copyright Year | 2013 |
| Keywords | logarithmic functions, graphs |