Display Title
Math Example: Graphs of Logarithmic Functions: Example 03
Display Title
Math Example: Graphs of Logarithmic Functions: Example 03

Topic
Logarithmic Functions
Description
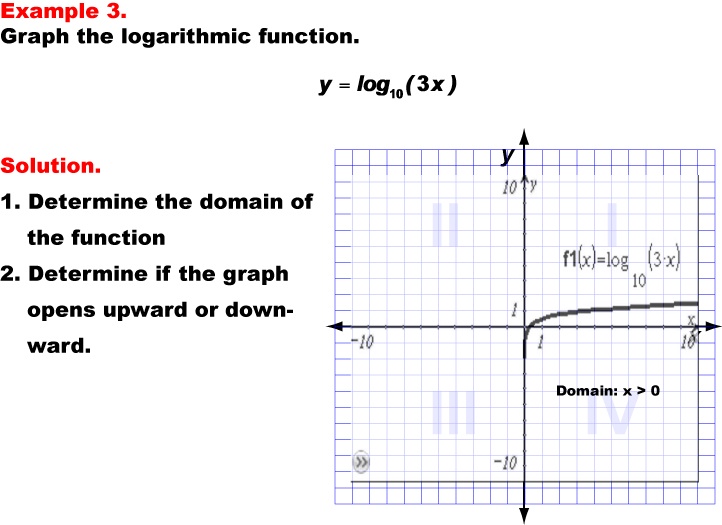
This example illustrates the graph of the logarithmic function y = log10(3x). The graph is similar to y = log10(x) but has been shifted horizontally. Students are asked to determine the domain and direction of this graph, observing how the multiplication by 3 inside the logarithm affects the function's behavior.
Logarithmic functions play a crucial role in various mathematical and scientific applications, from modeling exponential growth and decay to solving complex equations. This collection of examples helps teach logarithmic functions by presenting a range of equations with different parameters, allowing students to visualize and understand how these changes impact the graph's shape, position, and properties.
Exploring multiple worked-out examples is vital for students to develop a comprehensive understanding of logarithmic functions. Each example builds upon previous knowledge, introducing new concepts and transformations. This approach helps students recognize patterns, make connections between different forms of logarithmic equations, and develop problem-solving skills that can be applied to more complex scenarios.
Teacher's Script: Let's look at our third example, y = log10(3x). How does this graph compare to the basic logarithmic function we saw in the first example? Notice the shape is similar, but there's a change in position. Can you describe what's different? Think about how multiplying x by 3 inside the logarithm affects where the graph crosses the x-axis. How does this impact the domain of the function?
For a complete collection of math examples related to Logarithmic Functions click on this link: Math Examples: Graphs of Logarithmic Functions Collection.
| Common Core Standards | CCSS.MATH.CONTENT.HSF.IF.C.7, CCSS.MATH.CONTENT.HSF.IF.C.8.B, CCSS.MATH.CONTENT.HSF.BF.B.5, CCSS.MATH.CONTENT.HSF.IF.C.7.E, CCSS.Math.CONTENT.HSF.LE.A.2, CCSS.MATH.CONTENT.HSF.LE.A.3, CCSS.MATH.CONTENT.HSF.LE.A.4, CCSS.MATH.CONTENT.HSF.LE.B.5 |
|---|---|
| Grade Range | 9 - 12 |
| Curriculum Nodes |
Algebra • Exponential and Logarithmic Functions • Graphs of Exponential and Logarithmic Functions |
| Copyright Year | 2013 |
| Keywords | logarithmic functions, graphs |