Display Title
Math Example: Graphs of Logarithmic Functions: Example 12
Display Title
Math Example: Graphs of Logarithmic Functions: Example 12

Topic
Logarithmic Functions
Description
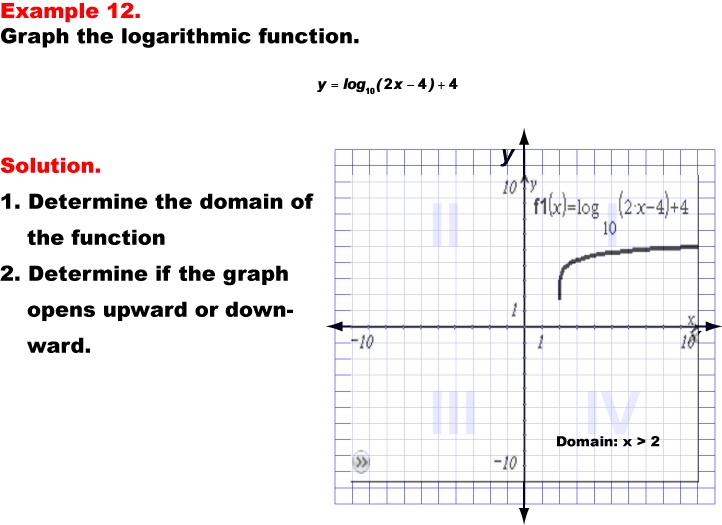
This example showcases the graph of the logarithmic function y = log10(2x - 4) + 4. The graph opens upward, demonstrating how the combination of multiplication and subtraction inside the logarithm, along with addition outside the logarithm, affect the function's behavior. The domain of this function is x > 2, as the expression inside the logarithm must be positive.
Logarithmic functions are essential in various fields, including science, engineering, and finance. They are particularly useful for modeling phenomena that exhibit exponential growth or decay. This collection of examples helps teach logarithmic functions by presenting a variety of equations with different transformations, allowing students to visualize and understand how these changes affect the graph's shape, position, and behavior.
Providing multiple worked-out examples is crucial for students to fully grasp the concept of logarithmic functions. Each example builds upon previous ones, introducing new transformations and combinations of operations. This approach helps students recognize patterns, understand the effects of different parameters, and develop the ability to predict how changes in the equation will impact the graph.
Teacher's Script: Now, let's examine our twelfth example, y = log10(2x - 4) + 4. Compare this graph to the previous example. Both have addition outside the logarithm, but this one has subtraction inside. How does this change the domain of the function? Notice that the domain is now x > 2. Can you explain why? The addition of 4 outside the logarithm shifts the graph vertically. How does the combination of 2x - 4 inside the logarithm affect the graph's horizontal position? Can you identify where this graph intersects the y-axis? Is there a y-intercept in this case? If not, why?
For a complete collection of math examples related to Logarithmic Functions click on this link: Math Examples: Graphs of Logarithmic Functions Collection.
| Common Core Standards | CCSS.MATH.CONTENT.HSF.IF.C.7, CCSS.MATH.CONTENT.HSF.IF.C.8.B, CCSS.MATH.CONTENT.HSF.BF.B.5, CCSS.MATH.CONTENT.HSF.IF.C.7.E, CCSS.Math.CONTENT.HSF.LE.A.2, CCSS.MATH.CONTENT.HSF.LE.A.3, CCSS.MATH.CONTENT.HSF.LE.A.4, CCSS.MATH.CONTENT.HSF.LE.B.5 |
|---|---|
| Grade Range | 9 - 12 |
| Curriculum Nodes |
Algebra • Exponential and Logarithmic Functions • Graphs of Exponential and Logarithmic Functions |
| Copyright Year | 2013 |
| Keywords | logarithmic functions, graphs |