Display Title
Math Example: Graphs of Logarithmic Functions: Example 15
Display Title
Math Example: Graphs of Logarithmic Functions: Example 15

Topic
Logarithmic Functions
Description
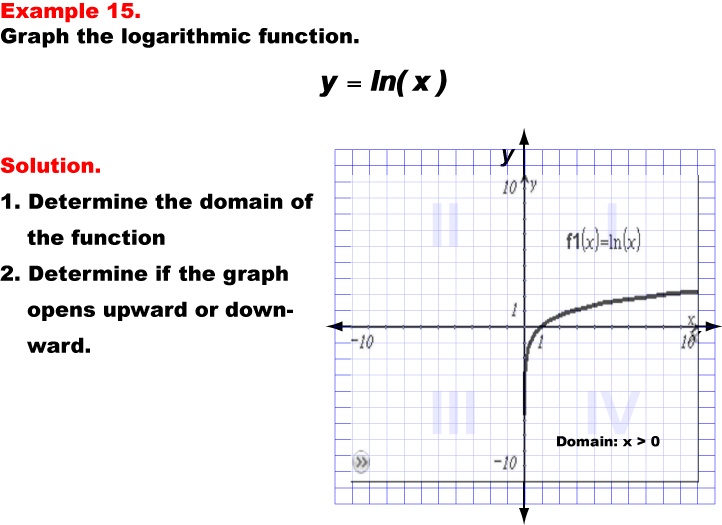
This example illustrates the graph of the natural logarithmic function y = ln(x). The graph opens upward, curving from left to right, demonstrating the basic shape and behavior of the natural logarithm. The domain of this function is x > 0, as the natural logarithm is only defined for positive real numbers.
Natural logarithmic functions, based on the mathematical constant e, are fundamental in various fields, including calculus, physics, and engineering. They are particularly useful for modeling natural phenomena and exponential growth or decay. This collection of examples helps teach logarithmic functions by presenting both common and natural logarithms, allowing students to compare and contrast their properties and behaviors.
Exploring multiple worked-out examples is vital for students to develop a comprehensive understanding of logarithmic functions, including natural logarithms. Each example builds upon previous knowledge, introducing new concepts and variations. This approach helps students recognize the similarities and differences between common and natural logarithms, and develop problem-solving skills that can be applied to more complex scenarios involving exponential and logarithmic relationships.
Teacher's Script: Let's examine our fifteenth example, y = ln(x). This is our first look at a natural logarithm function. How does this graph compare to the common logarithm (log base 10) we've been working with? Notice the similar shape, but can you spot any differences? The domain is still x > 0, just like with common logarithms. Can you explain why this is always true for logarithmic functions? Where does this function intersect the x-axis, and why is this point significant? Remember, ln(e) = 1, so this gives us an important point on the graph.
For a complete collection of math examples related to Logarithmic Functions click on this link: Math Examples: Graphs of Logarithmic Functions Collection.
| Common Core Standards | CCSS.MATH.CONTENT.HSF.IF.C.7, CCSS.MATH.CONTENT.HSF.IF.C.8.B, CCSS.MATH.CONTENT.HSF.BF.B.5, CCSS.MATH.CONTENT.HSF.IF.C.7.E, CCSS.Math.CONTENT.HSF.LE.A.2, CCSS.MATH.CONTENT.HSF.LE.A.3, CCSS.MATH.CONTENT.HSF.LE.A.4, CCSS.MATH.CONTENT.HSF.LE.B.5 |
|---|---|
| Grade Range | 9 - 12 |
| Curriculum Nodes |
Algebra • Exponential and Logarithmic Functions • Graphs of Exponential and Logarithmic Functions |
| Copyright Year | 2013 |
| Keywords | logarithmic functions, graphs |