Display Title
Math Example: Graphs of Logarithmic Functions: Example 24
Display Title
Math Example: Graphs of Logarithmic Functions: Example 24

Topic
Logarithmic Functions
Description
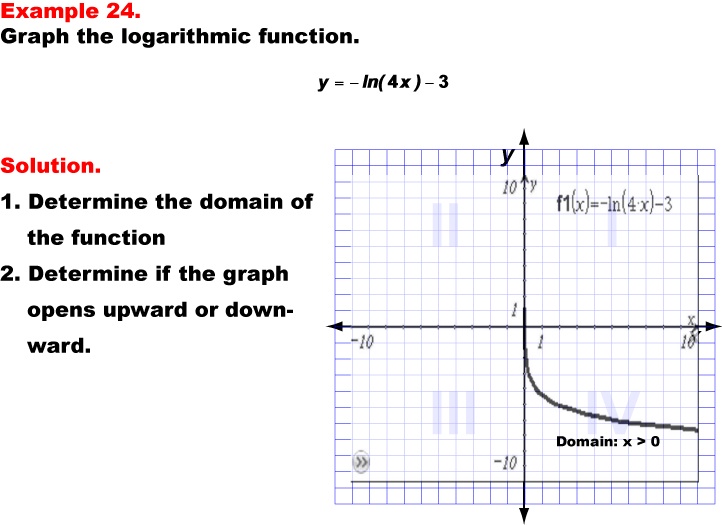
This example presents the graph of the negative natural logarithmic function y = -ln(4x) - 3. The graph opens downward, curving from right to left, demonstrating how the combination of a negative sign, multiplication inside the logarithm, and subtraction outside affects the function's behavior. The domain of this function remains x > 0, as the expression inside the natural logarithm must be positive.
Natural logarithmic functions, including their negatives and transformations, are essential in many scientific and mathematical applications, particularly in calculus and differential equations. They are often used to model complex decay processes and inverse exponential relationships in fields such as biology, physics, and economics. This collection of examples helps teach logarithmic functions by presenting a range of equations with different parameters, allowing students to visualize and understand how these changes impact the graph's shape, position, and range.
Providing multiple worked-out examples is crucial for students to fully grasp the concept of logarithmic functions and their transformations. Each example builds upon previous ones, introducing new variations and operations. This approach helps students recognize patterns, understand the effects of different parameters, and develop the ability to predict how changes in the equation will impact the graph of logarithmic functions.
Teacher's Script: Now, let's examine our twenty-fourth example, y = -ln(4x) - 3. Compare this graph to the previous negative natural logarithm function we just saw. What are the main differences you notice? The domain remains x > 0, but how has the range changed? Consider how the multiplication by 4 inside the logarithm affects the graph's horizontal position. Then, think about how the subtraction of 3 outside the logarithm impacts the vertical position. Can you predict where this graph will intersect the y-axis? How does this transformation impact the overall behavior of the function compared to the previous example with addition outside the logarithm?
For a complete collection of math examples related to Logarithmic Functions click on this link: Math Examples: Graphs of Logarithmic Functions Collection.
| Common Core Standards | CCSS.MATH.CONTENT.HSF.IF.C.7, CCSS.MATH.CONTENT.HSF.IF.C.8.B, CCSS.MATH.CONTENT.HSF.BF.B.5, CCSS.MATH.CONTENT.HSF.IF.C.7.E, CCSS.Math.CONTENT.HSF.LE.A.2, CCSS.MATH.CONTENT.HSF.LE.A.3, CCSS.MATH.CONTENT.HSF.LE.A.4, CCSS.MATH.CONTENT.HSF.LE.B.5 |
|---|---|
| Grade Range | 9 - 12 |
| Curriculum Nodes |
Algebra • Exponential and Logarithmic Functions • Graphs of Exponential and Logarithmic Functions |
| Copyright Year | 2013 |
| Keywords | logarithmic functions, graphs |