Display Title
Math Example--Inequalities-- Linear Inequalities: Example 4
Display Title
Math Example--Inequalities-- Linear Inequalities: Example 4

Topic
Inequalities
Description
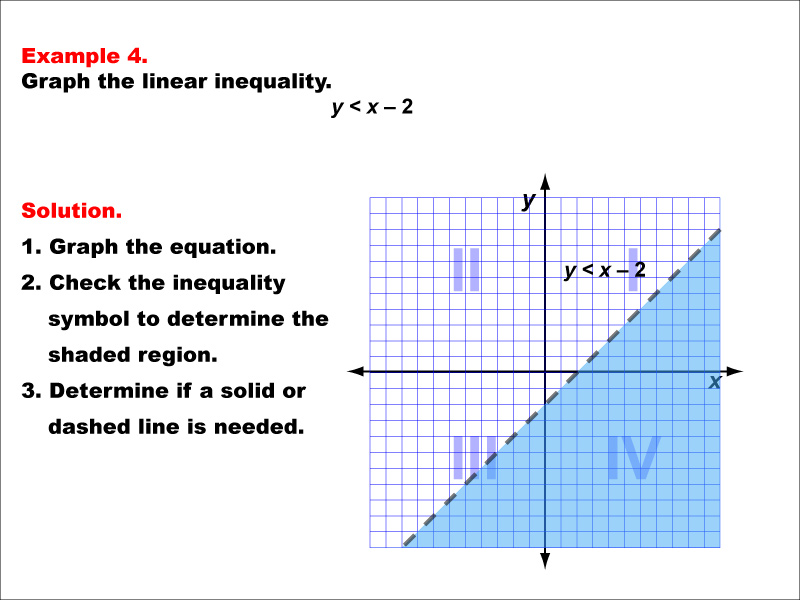
This example illustrates the graphing of the linear inequality y < x - 2. The graph features a dashed line representing the equation y = x - 2, with the area below the line shaded to indicate the region where the inequality holds true. The dashed line signifies that points on the line are not included in the solution set.
Linear inequalities are a fundamental concept in algebra, building upon students' understanding of linear equations and expanding it to include regions of the coordinate plane. This collection of examples aids in teaching this topic by providing visual representations of various inequalities, helping students grasp how different inequality symbols and equations translate into graphical form.
The importance of multiple worked-out examples cannot be overstated in helping students fully comprehend linear inequalities. Each example in this set highlights a different aspect of inequalities, allowing students to recognize patterns and develop a thorough understanding of how to graph and interpret these mathematical relationships.
Teacher's Script: Now, let's examine the inequality y < x - 2. Notice how we first graph the line y = x - 2, then shade the region below it. The dashed line indicates that points on the line are not included in our solution. How does this example differ from the previous ones we've seen? Why do we shade below the line this time?
For a complete collection of math examples related to Inequalities click on this link: Math Examples: Inequalities Collection.
| Common Core Standards | CCSS.MATH.CONTENT.6.EE.B.5, CCSS.MATH.CONTENT.7.EE.B.4.B, CCSS.MATH.CONTENT.HSA.REI.D.12 |
|---|---|
| Grade Range | 6 - 10 |
| Curriculum Nodes |
Algebra • Expressions, Equations, and Inequalities • Inequalities |
| Copyright Year | 2013 |
| Keywords | linear equations, inequalities |