Display Title
Math Example--Linear Function Concepts--Linear Data Model: Example 2
Display Title
Math Example--Linear Function Concepts--Linear Data Model: Example 2

Topic
Linear Functions
Description
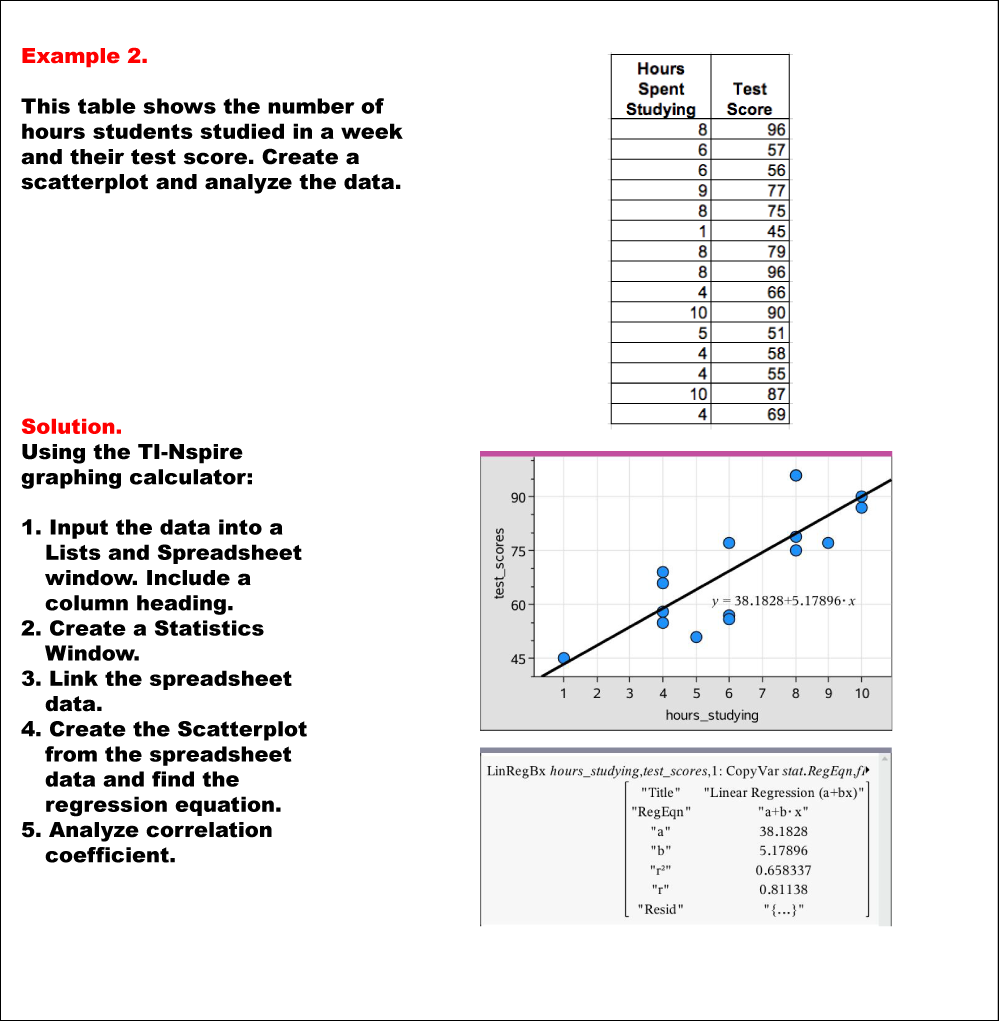
This image contains a table with data for "Hours Spent Studying" and "Test Score." A scatterplot is shown with a linear regression line, labeled with the equation y = 38.1828x + 5.17896. The correlation coefficient (r) is 0.658337, indicating moderate positive correlation between hours studied and test scores. The text guides users through creating a scatterplot using TI-Nspire, inputting data from a table into a spreadsheet, generating the regression equation y = 38.1828x + 5.17896, and analyzing the correlation coefficient (r = 0.658337). The process involves linking spreadsheet data and analyzing the linear relationship between variables using regression analysis. These worked examples focus on real-world data modeled as linear relationships, reinforcing key concepts.
Linear functions represent relationships where the change is constant. These examples provide practice with organizing, interpreting, and analyzing data in tables and graphs. By studying these examples, students build the foundational understanding necessary for modeling real-world scenarios.
Seeing multiple worked-out examples is essential for students to understand concepts deeply. Each example reinforces the concept by showing a different perspective or application, making abstract ideas tangible.
Teacher Script: Let’s look at this example of a linear relationship. Notice how the data in the table shows a consistent change in values. For instance, This image contains a table with data for "Hours Spent Studying" and "Test Score. What patterns can you identify, and how do they relate to the equation of a line?
For a complete collection of math examples related to Linear Functions click on this link: Math Examples: Linear Data Models Collection.
| Common Core Standards | CCSS.MATH.CONTENT.HSS.ID.B.6, CCSS.MATH.CONTENT.HSS.ID.B.6.A, CCSS.MATH.CONTENT.HSS.ID.B.6.C, CCSS.MATH.CONTENT.HSS.ID.B.6.B, CCSS.MATH.CONTENT.HSS.ID.C.7, CCSS.MATH.CONTENT.HSS.ID.C.8, CCSS.MATH.CONTENT.HSS.ID.C.9 |
|---|---|
| Grade Range | 8 - 12 |
| Curriculum Nodes |
Algebra • Probability and Data Analysis • Data Analysis |
| Copyright Year | 2020 |
| Keywords | linear regression |