Display Title
Math Example--Linear Function Concepts--Linear Functions in Tabular and Graph Form: Example 20
Display Title
Math Example--Linear Function Concepts--Linear Functions in Tabular and Graph Form: Example 20

Topic
Linear Functions
Description
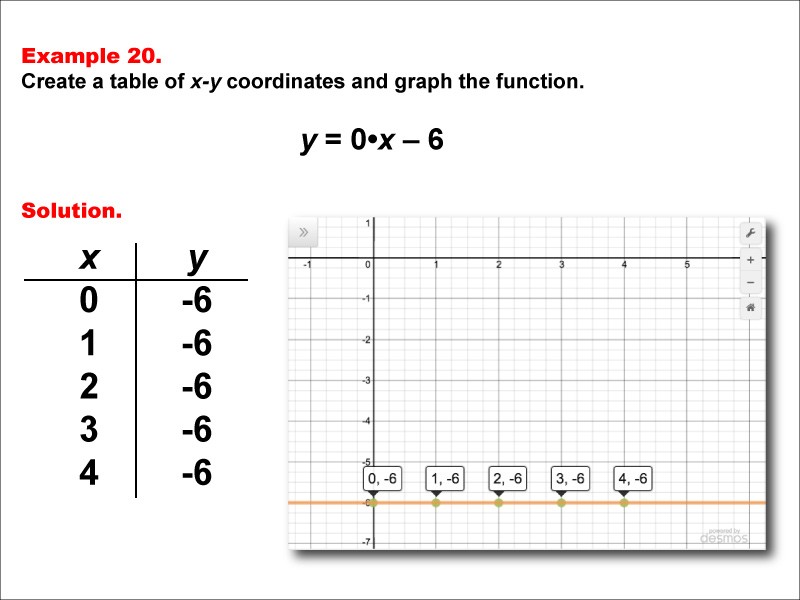
This example demonstrates how to create a table of x-y coordinates and graph the linear function y = 0x - 6. The image shows both a graph and a table representing this function. The table includes coordinate pairs (0, -6), (1, -6), (2, -6), (3, -6), and (4, -6), illustrating how the y-value remains constant at -6 for all values of x.
Linear functions are a fundamental concept in algebra, representing relationships where the rate of change between variables is constant. This collection of examples helps teach this topic by providing visual representations of various linear functions, allowing students to see how changes in the equation affect the graph and table of values.
Exposure to multiple worked-out examples is crucial for students to fully grasp the concept of linear functions. By seeing special cases like this one, where the slope is 0 but there's a non-zero y-intercept, students can develop a more comprehensive understanding of how these elements influence the function's behavior and recognize different forms of constant functions.
Teacher's Script: Now, let's analyze the function y = 0x - 6. How does this function compare to our previous example? Notice that regardless of the x-value, y always equals -6. What effect does this have on our graph? Can you explain why we get a horizontal line 6 units below the x-axis? How does this relate to our understanding of y-intercepts in linear functions?
For a complete collection of math examples related to Linear Functions click on this link: Math Examples: Linear Functions in Tabular and Graph Form Collection.
| Common Core Standards | CCSS.MATH.CONTENT.6.EE.C.9, CCSS.MATH.CONTENT.8.F.A.3 |
|---|---|
| Grade Range | 6 - 8 |
| Curriculum Nodes |
Algebra • Linear Functions and Equations • Graphs of Linear Functions |
| Copyright Year | 2015 |
| Keywords | function, linear functions, graphs of linear functions, function tables |