Display Title
Math Example--Linear Function Concepts--Linear Functions in Tabular and Graph Form: Example 4
Display Title
Math Example--Linear Function Concepts--Linear Functions in Tabular and Graph Form: Example 4

Topic
Linear Functions
Description
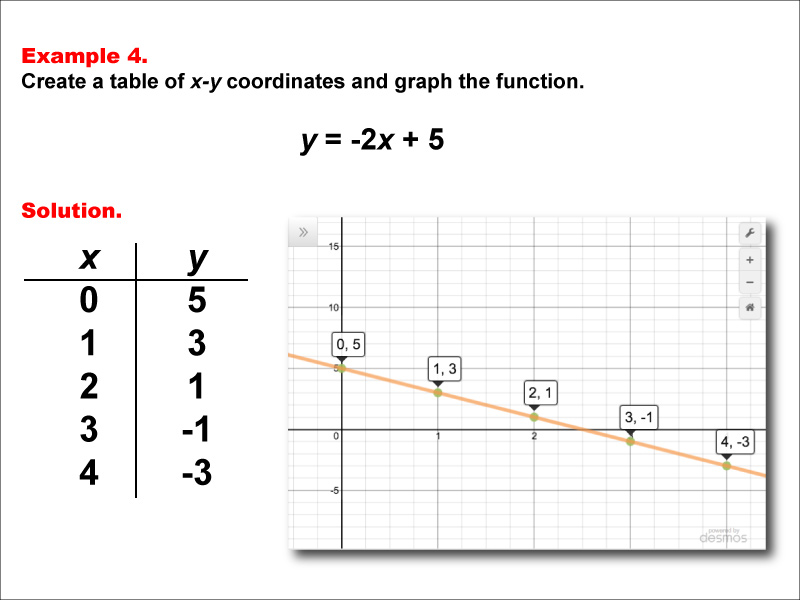
This example showcases the process of creating a table of x-y coordinates and graphing the linear function y = -2x + 5. The image presents both a graph and a table for this function. The table includes coordinate pairs (0, 5), (1, 3), (2, 1), (3, -1), and (4, -3), demonstrating how the y-value decreases by 2 for each unit increase in x.
Linear functions are a fundamental concept in algebra, representing relationships with a constant rate of change between variables. This collection of examples aids in teaching this topic by providing visual representations of various linear functions, enabling students to observe how changes in the equation affect both the graph and the table of values.
Exposing students to multiple worked-out examples is crucial for a comprehensive understanding of linear functions. By examining different slopes, including negative ones, y-intercepts, and various combinations of these elements, students can develop a deeper insight into how these components influence the function's behavior.
Teacher's Script: Now, let's analyze the function y = -2x + 5. What's different about this function compared to our previous examples? Notice the negative slope. How does this affect our graph and our table of values? The y-intercept is 5, which means our line crosses the y-axis at (0, 5). Can you see how these elements come together to form our function?
For a complete collection of math examples related to Linear Functions click on this link: Math Examples: Linear Functions in Tabular and Graph Form Collection.
| Common Core Standards | CCSS.MATH.CONTENT.6.EE.C.9, CCSS.MATH.CONTENT.8.F.A.3 |
|---|---|
| Grade Range | 6 - 8 |
| Curriculum Nodes |
Algebra • Linear Functions and Equations • Graphs of Linear Functions |
| Copyright Year | 2015 |
| Keywords | function, linear functions, graphs of linear functions, function tables |