Display Title
Math Example--Measures of Central Tendency--Mean of Data That Includes Negative Numbers--Example 2
Display Title
Math Example--Measures of Central Tendency--Mean of Data That Includes Negative Numbers--Example 2

Topic
Measures of Central Tendency
Description
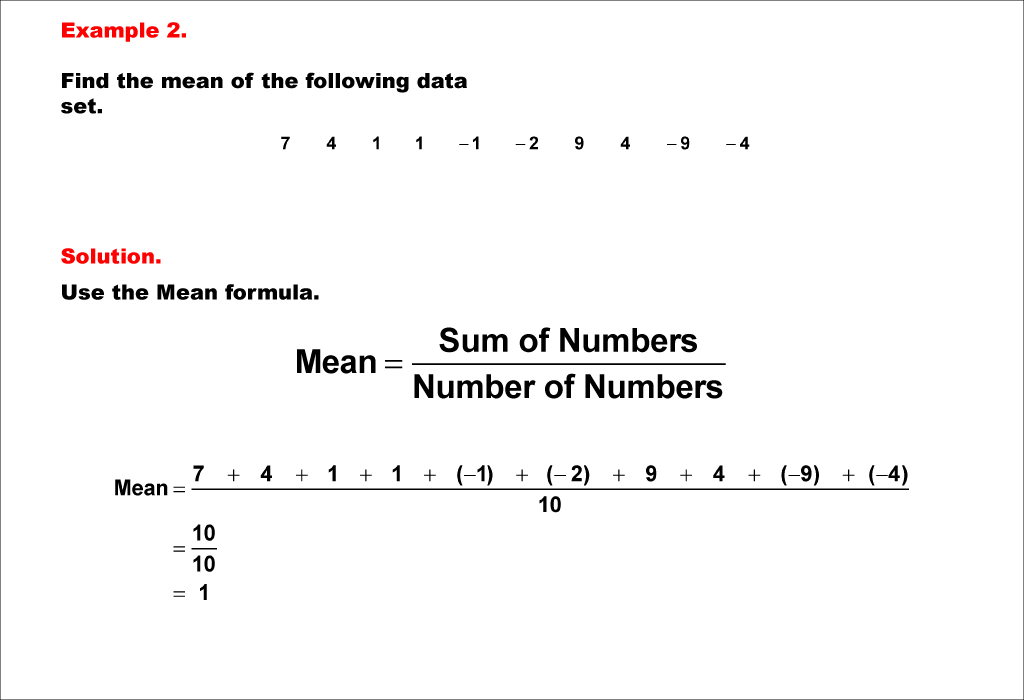
This example illustrates the calculation of the mean for a dataset containing both positive and negative numbers: 7, 4, 1, 1, -1, -2, 9, 4, -9, -4. The step-by-step process shows how to sum all values, including negative ones, and divide by the total number of data points to find the mean.
Understanding measures of central tendency, particularly the mean, is crucial in statistics and data analysis. This collection of examples helps students grasp the concept by providing diverse scenarios, emphasizing how to handle datasets with both positive and negative values. By working through these examples, students develop a solid foundation in calculating and interpreting the mean.
Exposure to multiple worked-out examples is essential for students to fully comprehend this concept. Each example reinforces the calculation process, helps students recognize patterns, and builds their confidence in tackling similar problems independently. This approach allows for a deeper understanding of how the mean represents the center of a dataset, regardless of the presence of negative numbers.
Teacher's Script: As we work through this example, pay close attention to how we treat positive and negative numbers equally in our calculation. Remember, the mean gives us a balanced representation of the entire dataset, considering all values regardless of their sign.
For a complete collection of math examples related to Measures of Central Tendency click on this link: Math Examples: Measures of Central Tendency: Mean Collection.
| Common Core Standards | CCSS.MATH.CONTENT.6.SP.B.5.C |
|---|---|
| Grade Range | 6 - 8 |
| Curriculum Nodes |
Algebra • Probability and Data Analysis • Data Analysis |
| Copyright Year | 2021 |
| Keywords | mean, measures of central tendency |