Display Title
Math Example--Measures of Central Tendency--Mean: Example 27
Display Title
Math Example--Measures of Central Tendency--Mean: Example 27

Topic
Measures of Central Tendency
Description
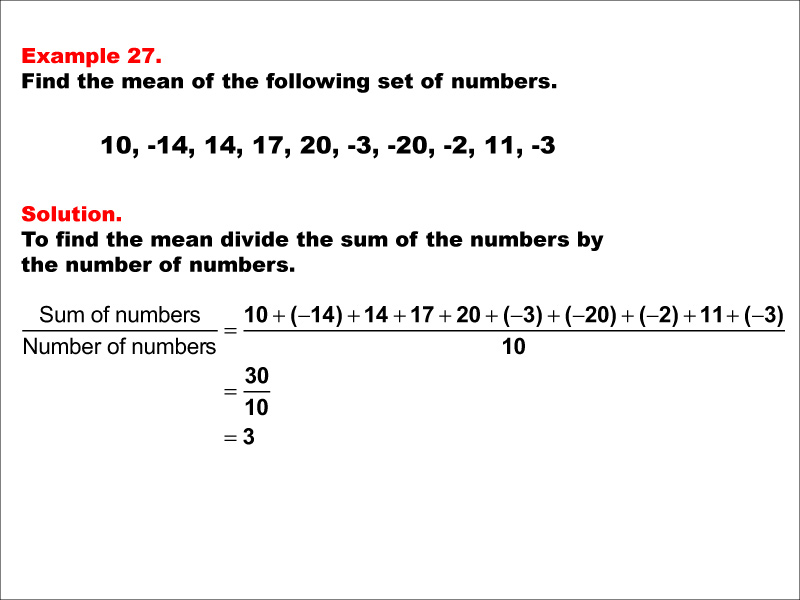
This example illustrates the calculation of the mean for the numbers 10, -14, 14, 17, 20, -3, -20, -2, 11, and -3. The process involves summing all values (30) and dividing by the count of numbers (10), resulting in a mean of 3. This example is particularly instructive as it demonstrates how to handle a mix of positive and negative numbers, including some relatively large values in both directions, in the calculation of the mean.
Understanding measures of central tendency, especially the mean, is fundamental in statistics and data analysis. These measures allow us to condense large datasets into single, representative values, facilitating comparisons and providing insights. Mastering these concepts, including working with a mix of positive and negative numbers of varying magnitudes, equips students with the tools to interpret data effectively and make informed decisions across various academic and real-world contexts.
Providing multiple examples, especially those involving both positive and negative numbers with different magnitudes, is crucial for deepening students' understanding of the mean. Each new example reinforces the calculation process while introducing slight variations in the data, helping students recognize that the concept applies universally, regardless of the sign or magnitude of the numbers. This approach builds confidence and prepares students to apply the concept flexibly in various real-world contexts, from analyzing financial data to interpreting scientific measurements.
Teacher Script: "Let's explore our twenty-seventh example of calculating the mean. Notice that this dataset includes both positive and negative numbers with varying magnitudes. As we work through this, think about how these different types of values affect our calculation. Does the final mean of 3 surprise you? Remember, the mean gives us a 'balance point' for our data. In this case, the positive values slightly outweigh the negative ones, resulting in a small positive mean. This example shows how the mean can provide valuable information about the overall trend of our data, even when it includes numbers that vary widely in both sign and magnitude. It's a great illustration of how the mean can 'smooth out' a dataset with extreme values."
For a complete collection of math examples related to Measures of Central Tendency click on this link: Math Examples: Measures of Central Tendency: Mean Collection.
| Common Core Standards | CCSS.MATH.CONTENT.6.SP.B.4, CCSS.MATH.CONTENT.6.SP.A.3, CCSS.MATH.CONTENT.HSS.ID.A.2, CCSS.MATH.CONTENT.HSS.ID.A.3 |
|---|---|
| Grade Range | 6 - 12 |
| Curriculum Nodes |
Algebra • Probability and Data Analysis • Data Analysis |
| Copyright Year | 2014 |
| Keywords | data analysis, tutorials, measures of central tendency, mean, average |