Display Title
Math Example--Measures of Central Tendency--Mean: Example 28
Display Title
Math Example--Measures of Central Tendency--Mean: Example 28

Topic
Measures of Central Tendency
Description
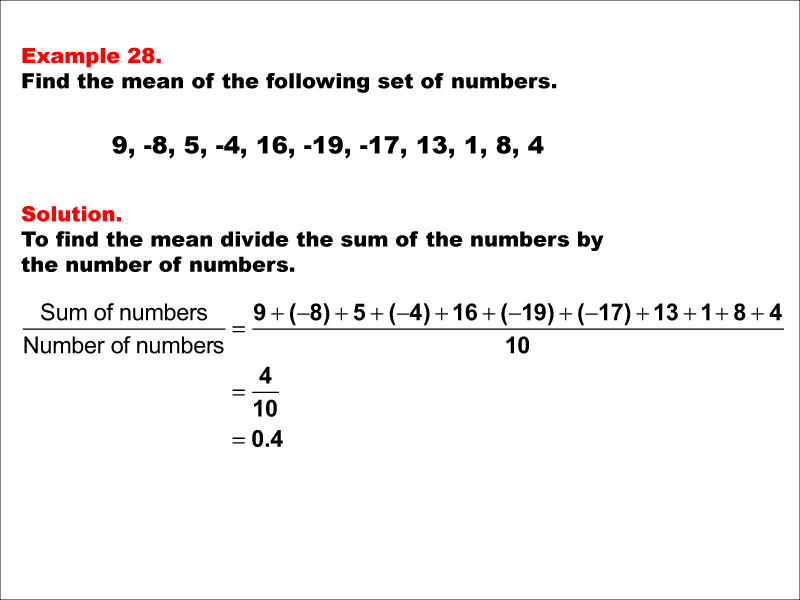
This example demonstrates the calculation of the mean for the numbers 9, -8, 5, -4, 16, -19, -17, 13, 1, 8, and 4. The process involves summing all values (4) and dividing by the count of numbers (10), resulting in a mean of 0.4. This example is particularly instructive as it shows how a mix of positive and negative numbers, including some relatively large values in both directions, can interact to produce a mean close to zero.
Understanding measures of central tendency, particularly the mean, is crucial in statistics and data analysis. These measures provide a way to summarize large amounts of data into a single, representative value, allowing for quick comparisons and insights. Mastering these concepts, especially when dealing with datasets that include both positive and negative numbers of varying magnitudes, enables students to interpret data effectively and make informed decisions in various fields of study.
The presentation of multiple examples, especially those with a mix of positive and negative numbers and varying magnitudes, is key to solidifying students' grasp of the mean concept. Each new example, while following the same basic process, presents a unique set of numbers with different characteristics. This repetition with variation helps students recognize the underlying principles and develop the flexibility to apply the concept across diverse situations, including those where the mean might not be immediately intuitive based on the raw data.
Teacher Script: "Let's examine our twenty-eighth example of calculating the mean. Notice how our dataset includes both positive and negative numbers, with some relatively large values in both directions. As we work through this, consider how these contrasting values affect our final result. The mean of 0.4 is very close to zero, which might be surprising given the presence of some large numbers in our set. This example illustrates an important point: the mean takes into account all values in a dataset, balancing out extremes. In real-world scenarios, this property of the mean can be both a strength and a weakness, depending on the context. It's crucial to always consider the entire dataset alongside the mean when interpreting data, especially when dealing with datasets that include both positive and negative values."
For a complete collection of math examples related to Measures of Central Tendency click on this link: Math Examples: Measures of Central Tendency: Mean Collection.
| Common Core Standards | CCSS.MATH.CONTENT.6.SP.B.4, CCSS.MATH.CONTENT.6.SP.A.3, CCSS.MATH.CONTENT.HSS.ID.A.2, CCSS.MATH.CONTENT.HSS.ID.A.3 |
|---|---|
| Grade Range | 6 - 12 |
| Curriculum Nodes |
Algebra • Probability and Data Analysis • Data Analysis |
| Copyright Year | 2014 |
| Keywords | data analysis, tutorials, measures of central tendency, mean, average |