Display Title
Math Example--Measures of Central Tendency--Mean of a Probability Distribution--Example 1
Display Title
Math Example--Measures of Central Tendency--Mean of a Probability Distribution--Example 1

Topic
Measures of Central Tendency
Description
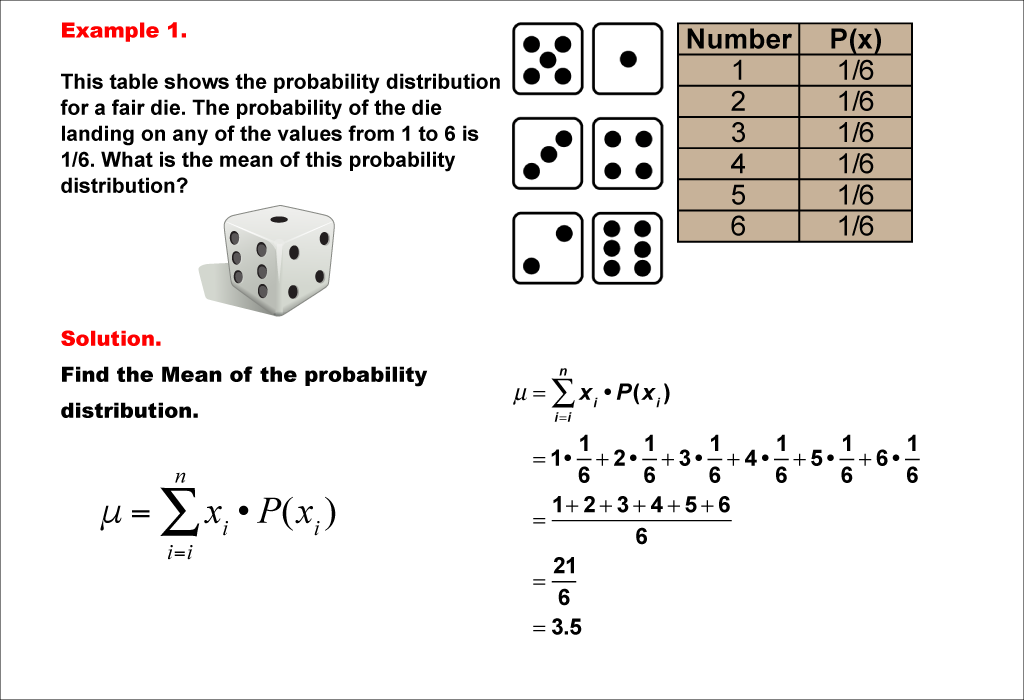
This example demonstrates the calculation of the mean for a probability distribution of a fair six-sided die. The probability of each outcome (1 to 6) is equally 1/6. The mean is calculated by multiplying each possible outcome by its probability and summing the results. For this fair die, the mean is determined to be 3.5.
The topic of measures of central tendency, specifically the mean of a probability distribution, is crucial in statistics and probability theory. This collection of examples helps teach this topic by presenting various scenarios, starting with a simple fair die and progressing to more complex situations. By examining different probability distributions, students can understand how the mean is calculated and how it represents the expected value of a random variable.
Providing multiple worked-out examples is essential for students to fully grasp this concept. Each example builds upon the previous one, allowing students to see how the calculation method remains consistent while the probabilities and outcomes change. This repetition reinforces the concept and helps students develop the skills to apply it to diverse situations.
Teacher's Script: Let's look at our first example of calculating the mean of a probability distribution. We have a fair six-sided die, where each number has an equal chance of appearing. To find the mean, we'll multiply each possible outcome by its probability and add them all together. This gives us the expected value or average outcome if we were to roll the die many times. Can you follow along with the calculation and see how we arrive at 3.5 as our answer?
For a complete collection of math examples related to Measures of Central Tendency click on this link: Math Examples: Measures of Central Tendency: Mean of a Probability Distribution Collection.
| Common Core Standards | CCSS.MATH.CONTENT.7.SP.A.2 |
|---|---|
| Grade Range | 6 - 10 |
| Curriculum Nodes |
Algebra • Probability and Data Analysis • Data Analysis |
| Copyright Year | 2021 |
| Keywords | mean, measures of central tendency |