Display Title
Math Example--Measures of Central Tendency--Mean of a Probability Distribution--Example 2
Display Title
Math Example--Measures of Central Tendency--Mean of a Probability Distribution--Example 2

Topic
Measures of Central Tendency
Description
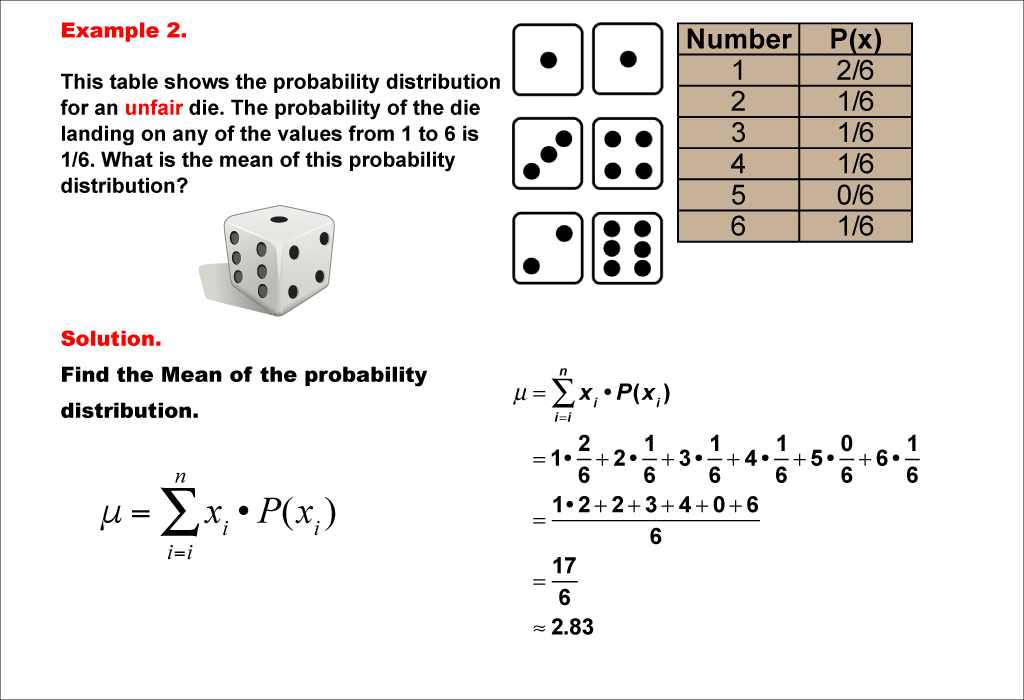
This example illustrates the calculation of the mean for a probability distribution of an unfair six-sided die. Unlike a fair die, the probabilities are not equally distributed, with a higher probability (2/6) for rolling a 1. The mean is calculated using the same method as before, resulting in approximately 2.83.
This collection of examples on measures of central tendency, focusing on the mean of probability distributions, helps students understand how to calculate expected values for various scenarios. By progressing from fair to unfair dice, students can observe how changes in probability affect the mean. This approach reinforces the concept that the mean represents the long-term average outcome of a random event.
Presenting multiple worked-out examples is crucial for students to develop a comprehensive understanding of this concept. Each example introduces a new variation, allowing students to apply the same calculation method to different probability distributions. This repetition helps solidify their understanding and improves their ability to tackle similar problems independently.
Teacher's Script: Now, let's examine an unfair die. Notice how the probabilities are different for each number, with a higher chance of rolling a 1. We'll use the same method to calculate the mean, but pay attention to how the uneven probabilities affect our result. Can you predict whether this mean will be higher or lower than that of a fair die? Let's work through the calculation together and see if your prediction is correct.
For a complete collection of math examples related to Measures of Central Tendency click on this link: Math Examples: Measures of Central Tendency: Mean of a Probability Distribution Collection.
| Common Core Standards | CCSS.MATH.CONTENT.7.SP.A.2 |
|---|---|
| Grade Range | 6 - 10 |
| Curriculum Nodes |
Algebra • Probability and Data Analysis • Data Analysis |
| Copyright Year | 2021 |
| Keywords | mean, measures of central tendency |