Display Title
Math Example--Measures of Central Tendency--Median: Example 8
Display Title
Math Example--Measures of Central Tendency--Median: Example 8

Topic
Measures of Central Tendency
Description
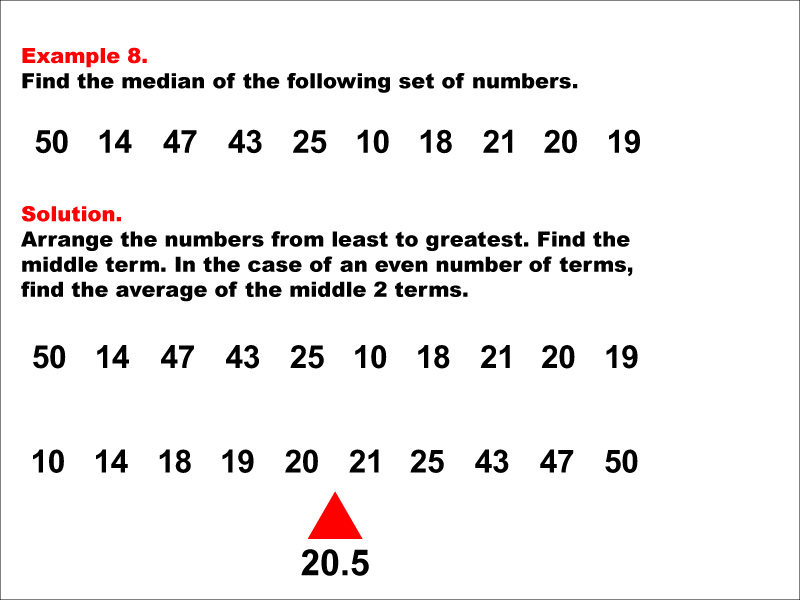
This example demonstrates how to find the median of the following set of numbers: 50, 14, 47, 43, 25, 10, 18, 21, 20, 19. The process involves arranging the numbers in ascending order and then identifying the middle value. With an even number of terms, the median is calculated as the average of the two middle terms, resulting in a median of 20.5.
The concept of median is a fundamental measure of central tendency in statistics. It represents the middle value in a sorted dataset, providing a robust measure that is less affected by extreme values compared to the mean. This collection of examples helps teach the topic by illustrating the step-by-step process of finding the median for various datasets, including those with even numbers of values.
Presenting multiple worked-out examples is crucial for students to fully grasp the concept of median. By encountering different scenarios, such as datasets with even or odd numbers of values, students can develop a comprehensive understanding of how to calculate the median in various situations. This approach reinforces the procedure and helps students recognize patterns and nuances in median calculation.
Teacher Script: "Let's look at this set of numbers. Notice that we have an even number of values. Remember, our first step is always to arrange the numbers from least to greatest. Once we've done that, we need to find the two middle numbers. Since we have an even number of terms, our median will be the average of these two middle numbers. This process helps us find the typical or central value in our dataset, which is useful for understanding the overall distribution of our data."
For a complete collection of math examples related to Measures of Central Tendency click on this link: Math Examples: Measures of Central Tendency: Median Collection.
| Common Core Standards | CCSS.MATH.CONTENT.6.SP.B.4, CCSS.MATH.CONTENT.6.SP.A.3, CCSS.MATH.CONTENT.HSS.ID.A.2, CCSS.MATH.CONTENT.HSS.ID.A.3 |
|---|---|
| Grade Range | 6 - 12 |
| Curriculum Nodes |
Algebra • Probability and Data Analysis • Data Analysis |
| Copyright Year | 2014 |
| Keywords | data analysis, tutorials, measures of central tendency, median, average |