Display Title
Math Example--Measures of Central Tendency--Mode: Example 42
Display Title
Math Example--Measures of Central Tendency--Mode: Example 42

Topic
Measures of Central Tendency
Description
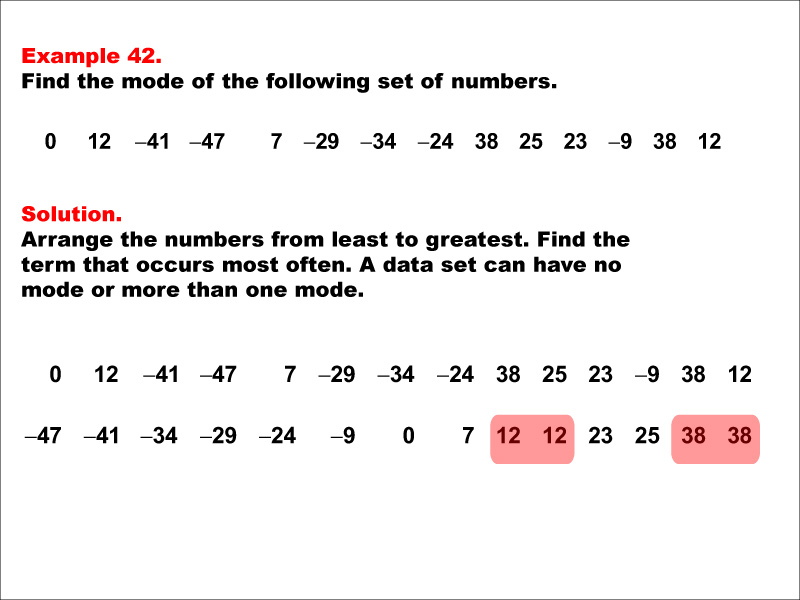
This example showcases a situation of measures of central tendency, where the goal is to identify a key summary measure in a set of data. Example 42 presents a set of numbers with instructions to find the mode. The numbers are sorted from least to greatest, and both 12 and 38 are highlighted as modes. This demonstrates that a data set can have multiple modes, even when it contains both positive and negative numbers.
Measures of Central Tendency lessons are instrumental in providing students with a better understanding of how to interpret data through these examples. Each example highlights distinct scenarios which reinforce the concept of determining frequency of occurrences within given sets, enhancing students' analytical skills.
Seeing multiple worked-out examples is crucial in solidifying a student's grasp on a concept. Each example contributes unique perspectives and challenges that can arise when thinking about data sets. This varied approach not only caters to diverse learning styles but also ensures that all students can see the relevance of these concepts in their learning journey.
Teacher's Script
In this example, we're presented with another set of numbers that includes both positive and negative values: 0, 12, -41, -47, 7, -29, -34, -24, 38, 25, 23, -9, 38, and 12. Our task is to find the mode. As we arrange these numbers from least to greatest, we notice something interesting – two numbers appear more frequently than the others. Can you spot them? That's right, both 12 and 38 appear twice, while all other numbers appear only once. This means we have two modes: 12 and 38. This situation is called a bimodal distribution. It's a great example of how real-world data can sometimes have more than one 'most frequent' value. In practical terms, this could represent a situation where we have two distinct groups or trends in our data. For instance, if these were temperature readings, it might suggest two common temperature ranges, perhaps representing different seasons or times of day.
For a complete collection of math examples related to Measures of Central Tendency click on this link: Math Examples: Measures of Central Tendency: Mode Collection.
| Common Core Standards | CCSS.MATH.CONTENT.6.SP.B.4, CCSS.MATH.CONTENT.6.SP.A.3, CCSS.MATH.CONTENT.HSS.ID.A.2, CCSS.MATH.CONTENT.HSS.ID.A.3 |
|---|---|
| Grade Range | 6 - 12 |
| Curriculum Nodes |
Algebra • Probability and Data Analysis • Data Analysis |
| Copyright Year | 2014 |
| Keywords | data analysis, tutorials, measures of central tendency, mode, average |