Display Title
Math Example--Measures of Central Tendency--Mode: Example 69
Display Title
Math Example--Measures of Central Tendency--Mode: Example 69

Topic
Measures of Central Tendency
Description
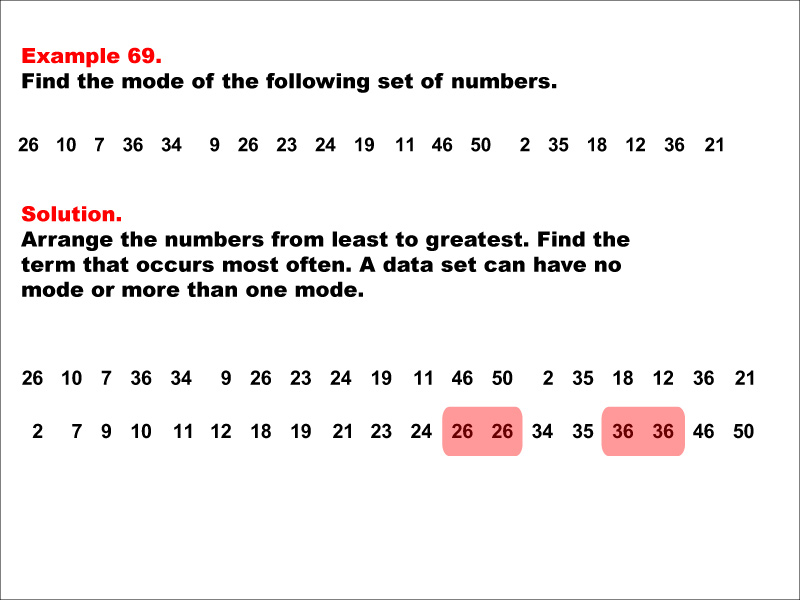
This example showcases a situation where there are multiple modes in a dataset. The image shows how numbers are arranged from least to greatest and highlights two modes: "26" and "36." This demonstrates that datasets can have more than one mode when two or more numbers appear with equal highest frequency.
Lessons on measures of central tendency help students understand how to interpret data using different statistical measures like mean and median along with mode.
The importance lies not just in finding one solution but exploring various scenarios through multiple examples which enhance comprehension by providing diverse perspectives on analyzing datasets effectively across different contexts such as academic performance analysis or market trend evaluations among others.
Teacher's Script
This example provides insight into how we identify modes within complex datasets containing repeating elements at varying frequencies; specifically here highlighting both "26" & "36". By sorting these values systematically first before identifying patterns becomes crucial especially when dealing real-world applications where variability often exists naturally requiring thorough examination prior drawing conclusions based solely upon initial observations alone without further investigation into underlying factors contributing towards observed outcomes ultimately leading towards informed decision-making processes overall thereby fostering critical thinking skills development amongst learners alike regardless field study involved whether mathematics science economics business etcetera alike!
For a complete collection of math examples related to Measures of Central Tendency click on this link: Math Examples: Measures of Central Tendency: Mode Collection.
| Common Core Standards | CCSS.MATH.CONTENT.6.SP.B.4, CCSS.MATH.CONTENT.6.SP.A.3, CCSS.MATH.CONTENT.HSS.ID.A.2, CCSS.MATH.CONTENT.HSS.ID.A.3 |
|---|---|
| Grade Range | 6 - 12 |
| Curriculum Nodes |
Algebra • Probability and Data Analysis • Data Analysis |
| Copyright Year | 2014 |
| Keywords | data analysis, tutorials, measures of central tendency, mode, average |