Display Title
Math Example--Measures of Central Tendency--Mode: Example 74
Display Title
Math Example--Measures of Central Tendency--Mode: Example 74

Topic
Measures of Central Tendency
Description
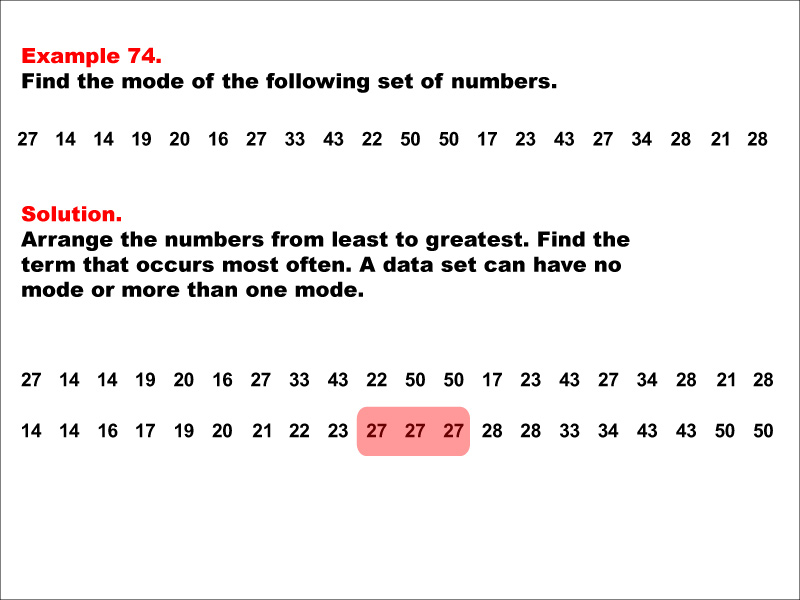
The image presents a math problem about finding the mode of a set of numbers. It shows the original set and the same set arranged in ascending order. The solution highlights the number 27 as occurring most frequently. This demonstrates how to identify the mode when a number appears more frequently than others in a data set.
Lessons on measures of central tendency help students understand how to interpret data using different statistical measures like mean and median along with mode.
Teacher's Script
This example provides insight into identifying modes within complex datasets containing repeating elements at varying frequencies; specifically here highlighting 27. By sorting these values systematically first before identifying patterns becomes crucial especially when dealing real-world applications where variability often exists naturally requiring thorough examination prior drawing conclusions based solely upon initial observations alone without further investigation into underlying factors contributing towards observed outcomes ultimately leading towards informed decision-making processes overall thereby fostering critical thinking skills development amongst learners alike regardless field study involved whether mathematics science economics business etcetera alike!
For a complete collection of math examples related to Measures of Central Tendency click on this link: Math Examples: Measures of Central Tendency: Mode Collection.
| Common Core Standards | CCSS.MATH.CONTENT.6.SP.B.4, CCSS.MATH.CONTENT.6.SP.A.3, CCSS.MATH.CONTENT.HSS.ID.A.2, CCSS.MATH.CONTENT.HSS.ID.A.3 |
|---|---|
| Grade Range | 6 - 12 |
| Curriculum Nodes |
Algebra • Probability and Data Analysis • Data Analysis |
| Copyright Year | 2014 |
| Keywords | data analysis, tutorials, measures of central tendency, mode, average |