Display Title
Math Example--Measures of Central Tendency--Mode: Example 75
Display Title
Math Example--Measures of Central Tendency--Mode: Example 75

Topic
Measures of Central Tendency
Description
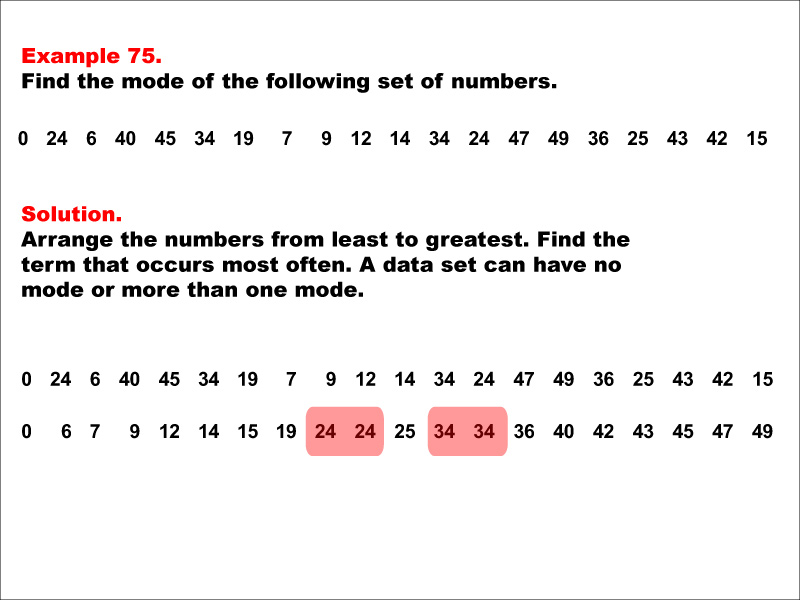
The image displays a math problem about finding the mode of a set of numbers. It includes the original set and the same set arranged in ascending order. The solution highlights two numbers, 24 and 34, as occurring most frequently. This demonstrates that a data set can have multiple modes, which occurs when two or more numbers appear with the highest frequency.
Lessons on measures of central tendency help students understand how to interpret data using different statistical measures like mean and median along with mode.
Teacher's Script
This example highlights identifying multiple modes within complex datasets containing varying frequencies elements distributed unevenly throughout entire range values present therein requiring thorough examination careful analysis order uncover hidden patterns trends potentially indicative significant underlying factors influencing observed outcomes ultimately aiding decision-making processes informed manner possible given available information contextually relevant circumstances encountered along way journey discovery knowledge acquisition exploration understanding comprehension application thereof practical settings everyday life situations encountered daily basis work personal lives alike!
For a complete collection of math examples related to Measures of Central Tendency click on this link: Math Examples: Measures of Central Tendency: Mode Collection.
| Common Core Standards | CCSS.MATH.CONTENT.6.SP.B.4, CCSS.MATH.CONTENT.6.SP.A.3, CCSS.MATH.CONTENT.HSS.ID.A.2, CCSS.MATH.CONTENT.HSS.ID.A.3 |
|---|---|
| Grade Range | 6 - 12 |
| Curriculum Nodes |
Algebra • Probability and Data Analysis • Data Analysis |
| Copyright Year | 2014 |
| Keywords | data analysis, tutorials, measures of central tendency, mode, average |