Display Title
Math Example--Measures of Central Tendency--Range: Example 17
Display Title
Math Example--Measures of Central Tendency--Range: Example 17

Topic
Measures of Central Tendency
Description
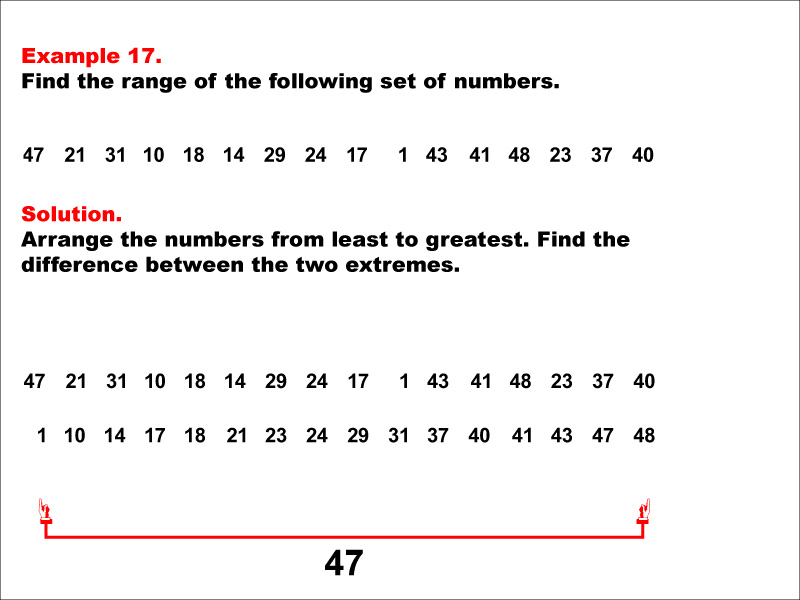
This example illustrates how to find the range of the following set of numbers: 47, 21, 31, 10, 18, 14, 29, 24, 17, 1, 43, 41, 48, 23, 37, 40. The solution involves arranging the numbers from least to greatest and finding the difference between the two extremes. The range is calculated to be 47. This example is valuable for understanding the concept of range, as it teaches students how to identify the maximum and minimum from a larger set of positive numbers and find their difference.
In the context of measures of central tendency, examples like this help students develop a deeper understanding of data analysis. The range provides insight into the spread of data, complementing other measures such as mean, median, and mode. By working through multiple examples with varying datasets, students can better grasp how these measures work together to provide a complete picture of data distribution.
Teacher's Script: Now, let's take a closer look at this example. We'll start by organizing our numbers from smallest to largest. Then, we'll identify the minimum and maximum values to calculate the range. This process will help us understand how the range represents the spread of our data. Notice how the range gives us a quick idea of how spread out our data is, but it doesn't tell us about the distribution of values in between. Can you think of how this might affect our interpretation of the data?
For a complete collection of math examples related to Measures of Central Tendency click on this link: Math Examples: Measures of Central Tendency: Range Collection.
| Common Core Standards | CCSS.MATH.CONTENT.6.SP.B.4, CCSS.MATH.CONTENT.7.SP.B.4, CCSS.MATH.CONTENT.6.SP.B.5.C |
|---|---|
| Grade Range | 6 - 8 |
| Curriculum Nodes |
Algebra • Probability and Data Analysis • Data Analysis |
| Copyright Year | 2014 |
| Keywords | data analysis, tutorials, measures of central tendency, range |