Display Title
Math Example--Measures of Central Tendency--Range: Example 7
Display Title
Math Example--Measures of Central Tendency--Range: Example 7

Topic
Measures of Central Tendency
Description
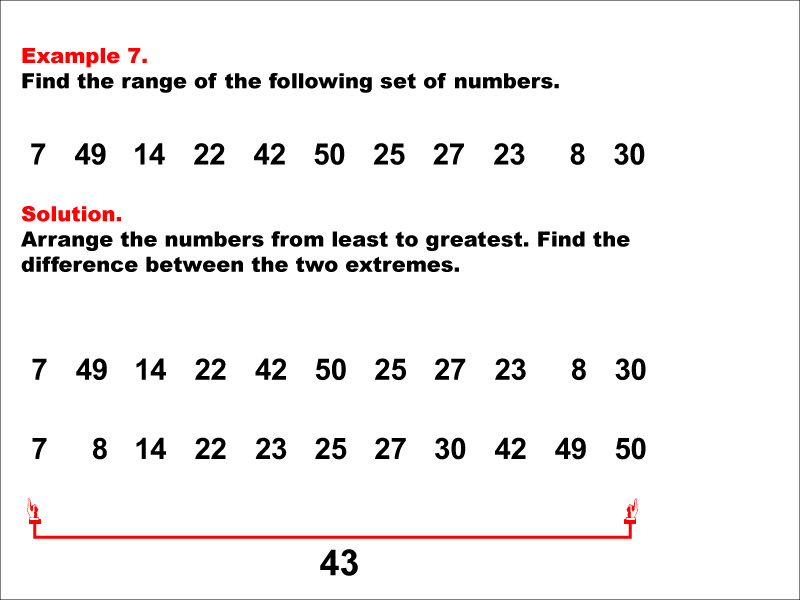
An illustration showing how to calculate the range by arranging numbers in order and finding the difference between extremes. This example demonstrates how to find the range of numbers 7, 49, 14, 22, 42, 50, 25, 27, 23, 8, 30. The solution involves sorting the numbers from 7 to 50 and calculating the range as 50 - 7 = 43. This example is valuable for understanding the concept of range, as it teaches students how to identify the maximum and minimum from a set of numbers and find their difference. The process encourages critical thinking and helps students visualize the relationship between numbers.
In teaching mathematics, it's crucial to present multiple worked-out examples. Students learn more effectively when they can see various methods applied to the same type of problem. These examples can clarify misunderstandings, reinforce knowledge, and build confidence when approaching mathematical concepts. Given that each student has a unique learning style, providing diverse strategies in problem-solving equips them for academic success.
Teacher's Script: Let's look closely at this example. As we identify the smallest and largest numbers in our set, we will see how their difference helps us find the range. This method will help us not only calculate, but also understand the overall concept better.
For a complete collection of math examples related to Measures of Central Tendency click on this link: Math Examples: Measures of Central Tendency: Range Collection.
| Common Core Standards | CCSS.MATH.CONTENT.6.SP.B.4, CCSS.MATH.CONTENT.7.SP.B.4, CCSS.MATH.CONTENT.6.SP.B.5.C |
|---|---|
| Grade Range | 6 - 8 |
| Curriculum Nodes |
Algebra • Probability and Data Analysis • Data Analysis |
| Copyright Year | 2014 |
| Keywords | data analysis, tutorials, measures of central tendency, range |