Display Title
Math Example--Measures of Central Tendency--Sample Mean--Example 3
Display Title
Math Example--Measures of Central Tendency--Sample Mean--Example 3

Topic
Measures of Central Tendency
Description
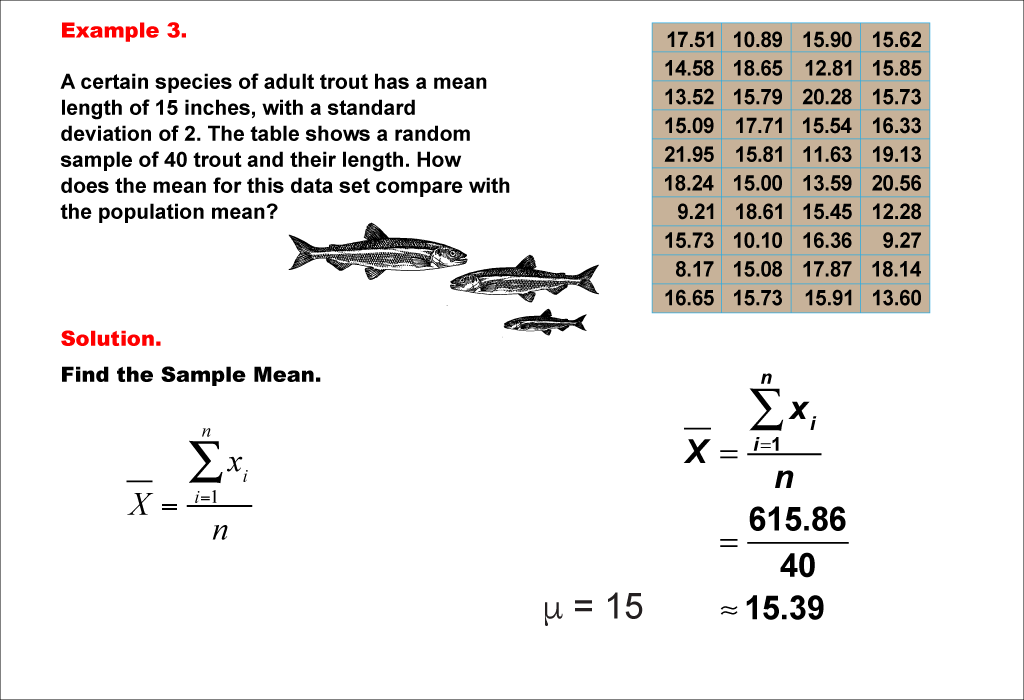
This example illustrates the calculation of the sample mean for a group of 40 trout. The image displays a table showing the lengths of these trout, along with the formula for calculating the sample mean. The population of adult trout has a mean length of 15 inches with a standard deviation of 2. The sample mean is calculated by summing all the lengths (615.86 inches) and dividing by the number of trout (40), resulting in a sample mean of 15.39 inches.
Measures of central tendency are essential in statistics, offering a way to describe the typical or central value in a dataset. This collection of examples supports teaching this topic by presenting various scenarios where the sample mean is calculated and compared to the known population mean. By using different sample sizes (30 in previous examples, 40 in this one) and populations (trout, macaws, elephants, sequoia trees), students can observe how sample means may vary but generally approximate the population mean.
Providing multiple worked-out examples is vital for students to fully grasp the concept of sample mean. Each example reinforces the calculation process while showcasing how sample means can differ from the population mean and from other samples. This repetition helps students develop confidence in their ability to calculate and interpret sample means across diverse situations, and understand the impact of sample size on the accuracy of estimates.
Teacher's Script: Now, let's look at our third example of calculating a sample mean. This time, we have data on the lengths of 40 trout. Notice that our sample size has increased. How might this affect our sample mean? Let's calculate it together. How does this sample mean compare to our previous examples and the population mean? What can we conclude about the relationship between sample size and the accuracy of our estimate?
For a complete collection of math examples related to Measures of Central Tendency click on this link: Math Examples: Measures of Central Tendency: Sample Mean Collection.
| Common Core Standards | CCSS.MATH.CONTENT.7.SP.A.2, CCSS.MATH.CONTENT.HSS.IC.B.4, CCSS.MATH.CONTENT.HSS.IC.B.5 |
|---|---|
| Grade Range | 6 - 8 |
| Curriculum Nodes |
Algebra • Probability and Data Analysis • Data Analysis |
| Copyright Year | 2021 |
| Keywords | mean, measures of central tendency, sample mean |