Display Title
Math Example--Quadratics--Quadratic Functions in Tabular and Graph Form: Example 1
Display Title
Math Example--Quadratics--Quadratic Functions in Tabular and Graph Form: Example 1
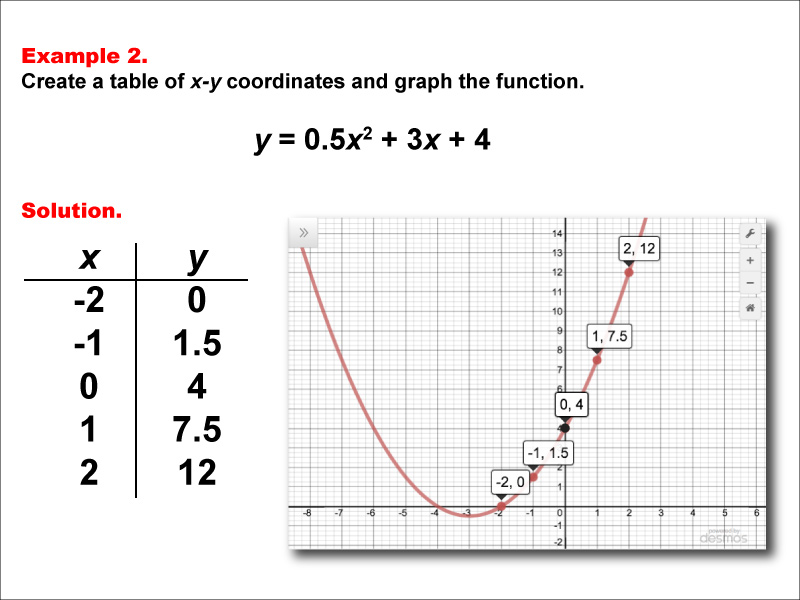
Quadratic Functions in Tabular and Graph Form: Example 2

Topic
Quadratics
Description
This example illustrates the relationship between quadratic functions and their graphical representations. The image shows a table of values and the corresponding graph of a quadratic function, highlighting how changes in the equation affect the graph's shape and position. Understanding this relationship is crucial for interpreting and predicting the behavior of quadratic functions. Skills involved include plotting points, recognizing parabolic shapes, and analyzing vertex and axis of symmetry.
For a complete collection of math examples related to Quadratics click on this link: Math Examples: Quadratics Collection.
| Common Core Standards | CCSS.MATH.CONTENT.HSF.IF.C.7.A, CCSS.MATH.CONTENT.HSF.LE.A.3 |
|---|---|
| Grade Range | 9 - 12 |
| Curriculum Nodes |
Algebra • Quadratic Functions and Equations • Graphs of Quadratic Functions • Quadratic Equations and Functions |
| Copyright Year | 2015 |
| Keywords | function, quadratic functions, graphs of quadratic functions, quadratic function tables |