Display Title
Math Example--Quadratics--Quadratic Functions in Tabular and Graph Form: Example 10
Display Title
Quadratic Functions in Tabular and Graph Form: Example 10

Topic
Quadratics
Description
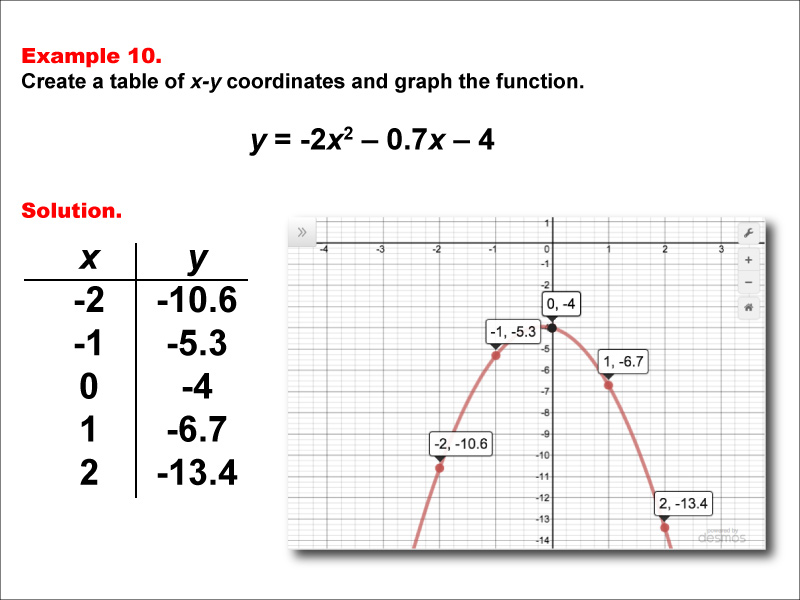
In this image, a quadratic function is shown in tabular representation and graphical output. Analyzing both forms allows students to connect numerical outputs with their geometric interpretations. Skills such as graphing and understanding symmetry are vital in this context. Multiple representations of functions, such as tables and graphs, are invaluable for learning as they provide different perspectives on the same mathematical concept. They enhance comprehension by allowing students to visualize the relationship between algebraic expressions and their graphical counterparts, facilitating a deeper understanding of mathematical relationships.
For a complete collection of math examples related to Quadratics click on this link: Math Examples: Quadratics Collection.
| Common Core Standards | CCSS.MATH.CONTENT.HSF.IF.C.7.A, CCSS.MATH.CONTENT.HSF.LE.A.3 |
|---|---|
| Grade Range | 9 - 12 |
| Curriculum Nodes |
Algebra • Quadratic Functions and Equations • Graphs of Quadratic Functions • Quadratic Equations and Functions |
| Copyright Year | 2015 |
| Keywords | function, quadratic functions, graphs of quadratic functions, quadratic function tables |