Display Title
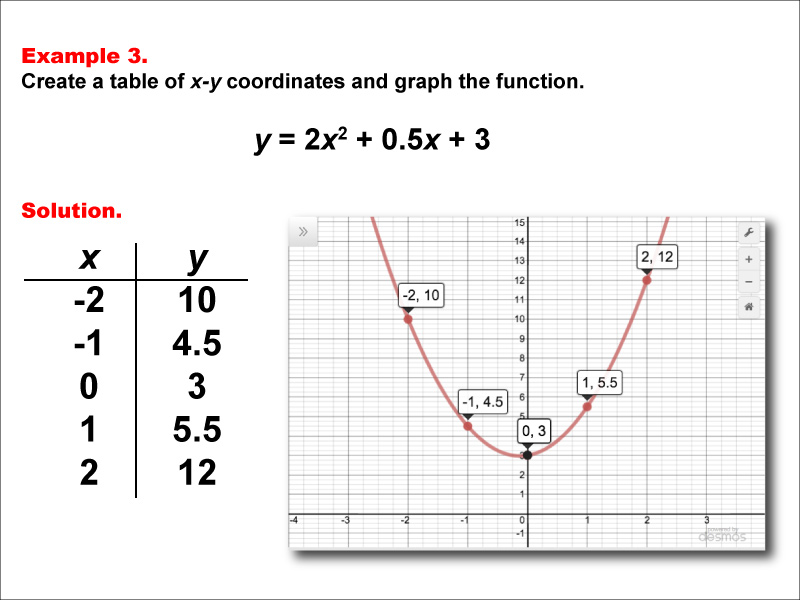
Math Example--Quadratics--Quadratic Functions in Tabular and Graph Form: Example 3
Display Title
Quadratic Functions in Tabular and Graph Form: Example 3

Topic
Quadratics
Description
This example illustrates a quadratic function through both a tabular data set and its corresponding graph. The table presents specific input-output pairs that, when plotted, form a parabolic curve on the graph. This visual representation highlights the quadratic function's key features, such as the vertex, axis of symmetry, and intercepts. The table allows for a clear understanding of how each value corresponds to a point on the graph, demonstrating the function's behavior over a range of inputs.
The quadratic function is expressed in standard form, and the graph depicts the parabola's shape, showing how the coefficients affect its direction and width. The vertex serves as the parabola's highest or lowest point, and the axis of symmetry divides the graph into two mirror images. Recognizing these features is crucial for analyzing and predicting the function's behavior.
Multiple representations of functions, such as tables and graphs, are invaluable for learning as they provide different perspectives on the same mathematical concept. They enhance comprehension by allowing students to visualize the relationship between algebraic expressions and their graphical counterparts, facilitating a deeper understanding of mathematical relationships.
For a complete collection of math examples related to Quadratics click on this link: Math Examples: Quadratics Collection.
| Common Core Standards | CCSS.MATH.CONTENT.HSF.IF.C.7.A, CCSS.MATH.CONTENT.HSF.LE.A.3 |
|---|---|
| Grade Range | 9 - 12 |
| Curriculum Nodes |
Algebra • Quadratic Functions and Equations • Graphs of Quadratic Functions • Quadratic Equations and Functions |
| Copyright Year | 2015 |
| Keywords | function, quadratic functions, graphs of quadratic functions, quadratic function tables |