Display Title
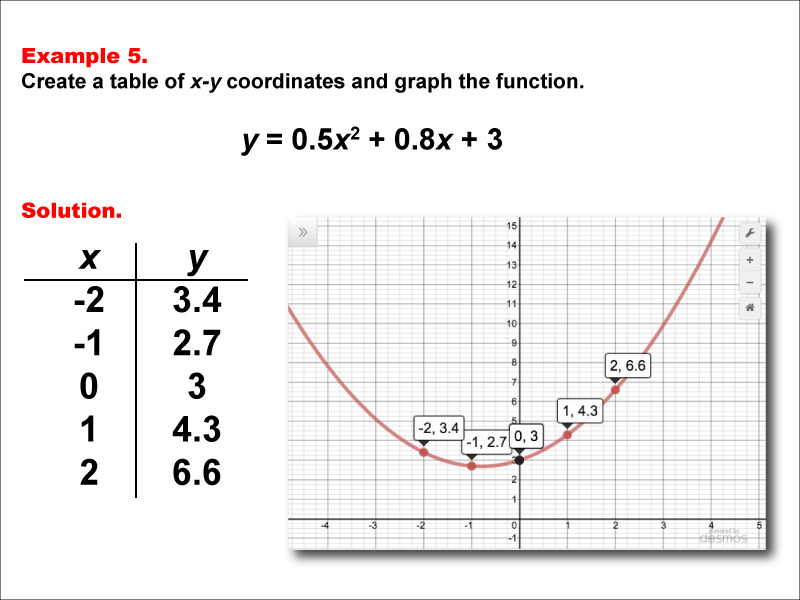
Math Example--Quadratics--Quadratic Functions in Tabular and Graph Form: Example 5
Display Title
Quadratic Functions in Tabular and Graph Form: Example 5

Topic
Quadratics
Description
This example provides a quadratic function displayed in both tabular and graphical forms. The table lists values that, when plotted, create a parabolic curve on the graph. This visual representation helps in identifying key features such as the vertex, axis of symmetry, and roots. By analyzing these features, students can understand the impact of different coefficients on the shape and position of the parabola. Skills involved include interpreting data from tables, graphing functions, and understanding the vertex and standard forms of quadratic equations.
Utilizing multiple representations of functions, like tables and graphs, is valuable for learning as it offers varied insights into the behavior of functions, aiding in the visualization and analysis of mathematical relationships.
For a complete collection of math examples related to Quadratics click on this link: Math Examples: Quadratics Collection.
| Common Core Standards | CCSS.MATH.CONTENT.HSF.IF.C.7.A, CCSS.MATH.CONTENT.HSF.LE.A.3 |
|---|---|
| Grade Range | 9 - 12 |
| Curriculum Nodes |
Algebra • Quadratic Functions and Equations • Graphs of Quadratic Functions • Quadratic Equations and Functions |
| Copyright Year | 2015 |
| Keywords | function, quadratic functions, graphs of quadratic functions, quadratic function tables |