Display Title
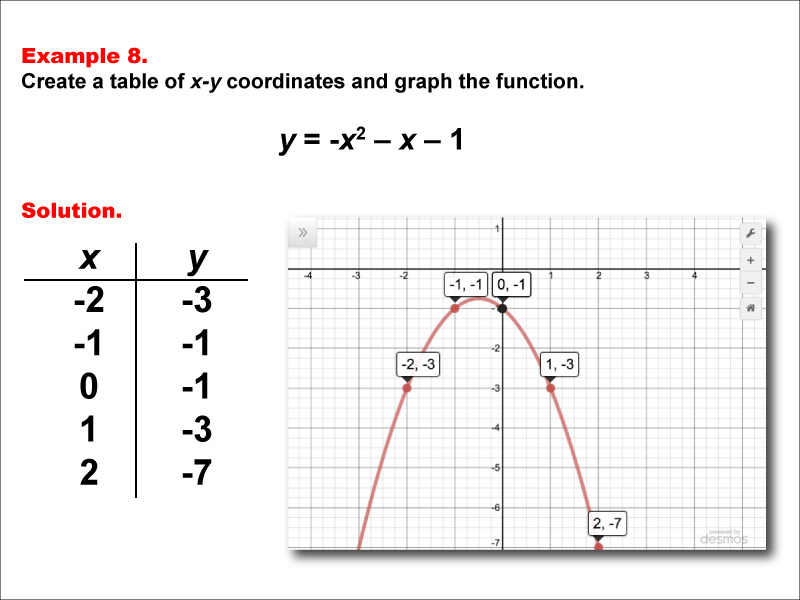
Math Example--Quadratics--Quadratic Functions in Tabular and Graph Form: Example 8
Display Title
Quadratic Functions in Tabular and Graph Form: Example 8

Topic
Quadratics
Description
This image presents a quadratic function in tabular and graphic format. The graph reflects the nature of parabolic functions, while the table reinforces the numerical data needed for graphing. By exploring both representations, students can appreciate the convergence of algebra and geometry, honing their capacity for critical thinking and analysis. Understanding the properties of the parabola is essential for mastery in quadratic equations by applying skills such as completing the square or using the quadratic formula.
Multiple representations of functions, such as tables and graphs, are invaluable for learning as they provide different perspectives on the same mathematical concept. They enhance comprehension by allowing students to visualize the relationship between algebraic expressions and their graphical counterparts, facilitating a deeper understanding of mathematical relationships.
For a complete collection of math examples related to Quadratics click on this link: Math Examples: Quadratics Collection.
| Common Core Standards | CCSS.MATH.CONTENT.HSF.IF.C.7.A, CCSS.MATH.CONTENT.HSF.LE.A.3 |
|---|---|
| Grade Range | 9 - 12 |
| Curriculum Nodes |
Algebra • Quadratic Functions and Equations • Graphs of Quadratic Functions • Quadratic Equations and Functions |
| Copyright Year | 2015 |
| Keywords | function, quadratic functions, graphs of quadratic functions, quadratic function tables |