Display Title
Math Example--Rational Concepts--Rational Functions in Tabular and Graph Form: Example 17
Display Title
Math Example--Rational Concepts--Rational Functions in Tabular and Graph Form: Example 17

Topic
Rational Functions
Description
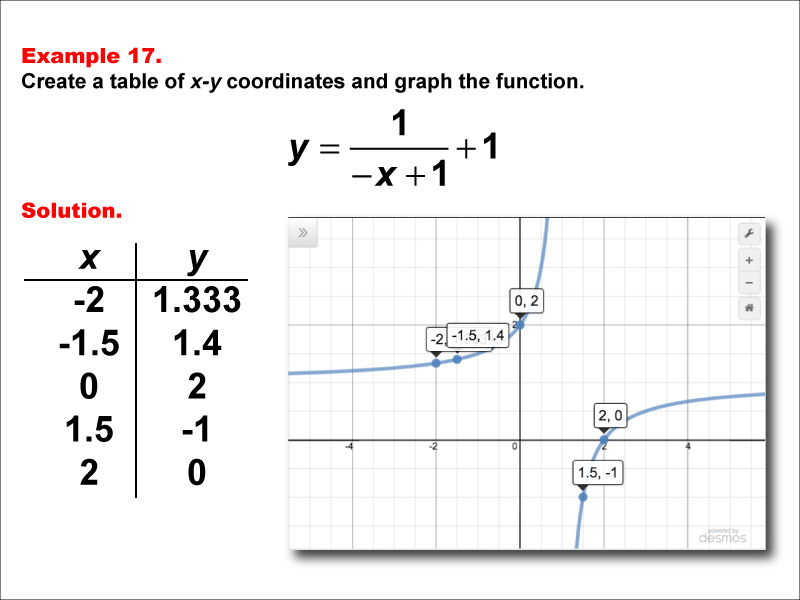
This math example demonstrates the creation of a table of x-y coordinates and the graphing of the function y = 1 / (-x + 1) + 1. The image showcases both the table of x-y coordinates and the resulting graph. Points plotted include (-2, 1.333), (-1.5, 1.4), (0, 2), (1.5, -1), and (2, 0). The graph features a hyperbola with asymptotes, illustrating how negating the x-term in the denominator and adding a constant affects the graph's shape and position.
Rational functions are an important concept in algebra and calculus, representing the ratio of two polynomial functions with additional transformations. This collection of examples aids in teaching this topic by providing visual representations of various rational functions, allowing students to observe how alterations in the function impact its graph. By studying multiple examples, students can identify patterns and develop a comprehensive understanding of how negations and constants in different parts of the function shift and reflect the graph.
The importance of presenting multiple worked-out examples cannot be overstated when it comes to students fully grasping the concept of rational functions and their transformations. Each example builds upon the previous ones, introducing slight variations in the function that result in different graph shapes and positions. This approach enhances students' pattern recognition skills and improves their ability to predict the behavior of rational functions based on their equations.
Teacher's Script: Let's examine our seventeenth example: y = 1 / (-x + 1) + 1. How does this function compare to our previous examples? Notice that we've negated the x-term in the denominator and added 1 to the entire fraction. What effect do you think these changes will have on the graph? As you observe the graph, can you explain why the asymptotes are positioned where they are? How does this graph compare to y = 1 / (x + 1) + 1? As we continue with more examples, pay attention to how combinations of negations and constants in different parts of the function affect the position and shape of the graph.
For a complete collection of math examples related to Rational Functions click on this link: Math Examples: Rational Functions in Tables and Graphs Collection.
| Common Core Standards | CCSS.MATH.CONTENT.HSF.IF.C.7.A, CCSS.MATH.CONTENT.HSF.IF.C.7.D |
|---|---|
| Grade Range | 9 - 12 |
| Curriculum Nodes |
Algebra • Rational Expressions and Functions • Rational Functions and Equations |
| Copyright Year | 2015 |
| Keywords | function, rational functions, graphs of rational functions, rational function tables |