Display Title
Math Example--Special Functions--Square Root Functions in Tabular and Graph Form: Example 27
Display Title
Math Example--Special Functions--Square Root Functions in Tabular and Graph Form: Example 27

Topic
Radical Functions
Description
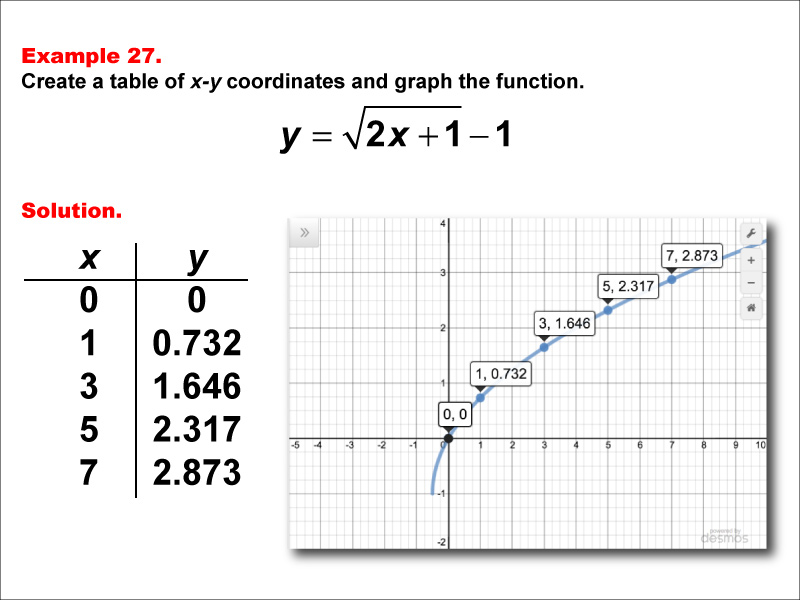
This example demonstrates the function y = √(2x + 1) - 1. The graph shows an increasing curve starting at (0, 0) and rising more steeply as x increases. A table lists x-values (0, 1, 3, 5, 7) with corresponding y-values (0, 0.732, 1.646, 2.317, and 2.873). Students are asked to create a table of x-y coordinates and graph the function.
This example builds on previous ones by introducing a coefficient inside the square root along with a constant term outside. It helps students understand how these factors affect the shape of the graph and its steepness. By comparing this function to y = √(x + 1) - 1, students can visualize how different coefficients inside the square root influence the function's behavior.
Providing multiple examples with different coefficients is essential for developing a deep understanding of square root functions. Each example challenges students to apply what they've learned in new contexts while recognizing patterns between equations and their graphs.
Teacher's Script: Let's look at the function y = √(2x + 1) - 1. How do you think this graph will compare to our previous example? We'll use x-values of 0, 1, 3, 5, and 7 again. Notice how the y-values increase faster this time as we plot these points on our graph. Can anyone explain why this happens?
For a complete collection of math examples related to Radical Functions click on this link: Math Examples: Square Root Functions Collection.
| Common Core Standards | CCSS.MATH.CONTENT.HSF.IF.C.7, CCSS.MATH.CONTENT.HSF.IF.C.7.B |
|---|---|
| Grade Range | 9 - 12 |
| Curriculum Nodes |
Algebra • Radical Expressions and Functions • Radical Functions and Equations |
| Copyright Year | 2015 |
| Keywords | function, square root functions, graphs of square root functions, square root function tables |