Display Title
Math Example--Special Functions--Square Root Functions in Tabular and Graph Form: Example 28
Display Title
Math Example--Special Functions--Square Root Functions in Tabular and Graph Form: Example 28

Topic
Radical Functions
Description
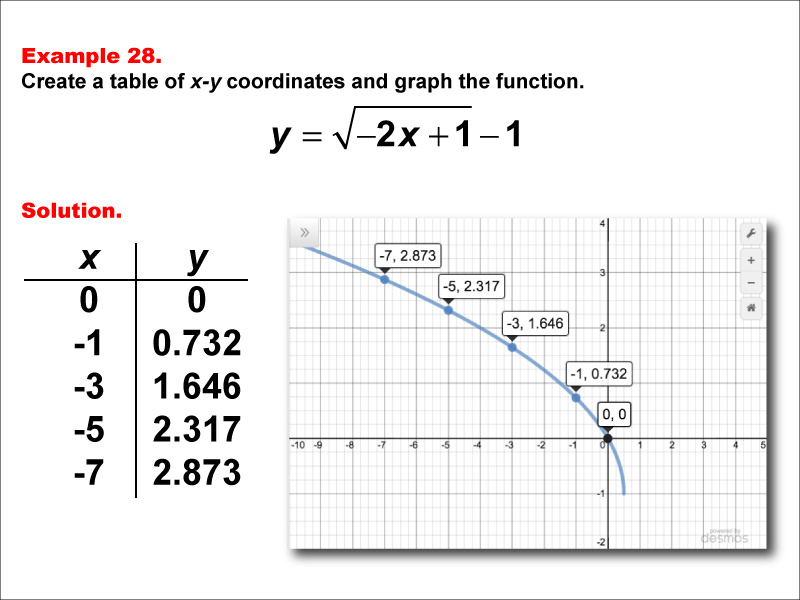
This example explores the function y = √(-2x + 1) - 1. The graph shows a downward curve starting at (0, 0) and moving downward as x becomes more negative. A table lists x-values (0, -1, -3, -5, -7) with corresponding y-values of 0, 0.732, 1.646, 2.317, and 2.873. Students are tasked with creating a table of x-y coordinates and graphing the function using these values.
This example introduces students to square root functions with negative coefficients inside the radical combined with constant terms outside it. It helps them understand how these factors affect both direction and domain restrictions for non-positive x-values.
The variety of examples is crucial for building comprehensive understanding—each new one challenges students differently while reinforcing key concepts about relationships between equations/graphs.
Teacher's Script: Let's examine the function y = √(-2x + 1) - 1. How do you think this graph will differ from our previous examples? We'll create a table of x-y coordinates using non-positive x-values: 0, -1, -3, -5, and -7. Notice how the y-values increase as we move leftward on the x-axis. Can anyone explain why this happens?
For a complete collection of math examples related to Radical Functions click on this link: Math Examples: Square Root Functions Collection.
| Common Core Standards | CCSS.MATH.CONTENT.HSF.IF.C.7, CCSS.MATH.CONTENT.HSF.IF.C.7.B |
|---|---|
| Grade Range | 9 - 12 |
| Curriculum Nodes |
Algebra • Radical Expressions and Functions • Radical Functions and Equations |
| Copyright Year | 2015 |
| Keywords | function, square root functions, graphs of square root functions, square root function tables |