Display Title
Math Example--Special Functions--Square Root Functions in Tabular and Graph Form: Example 29
Display Title
Math Example--Special Functions--Square Root Functions in Tabular and Graph Form: Example 29

Topic
Radical Functions
Description
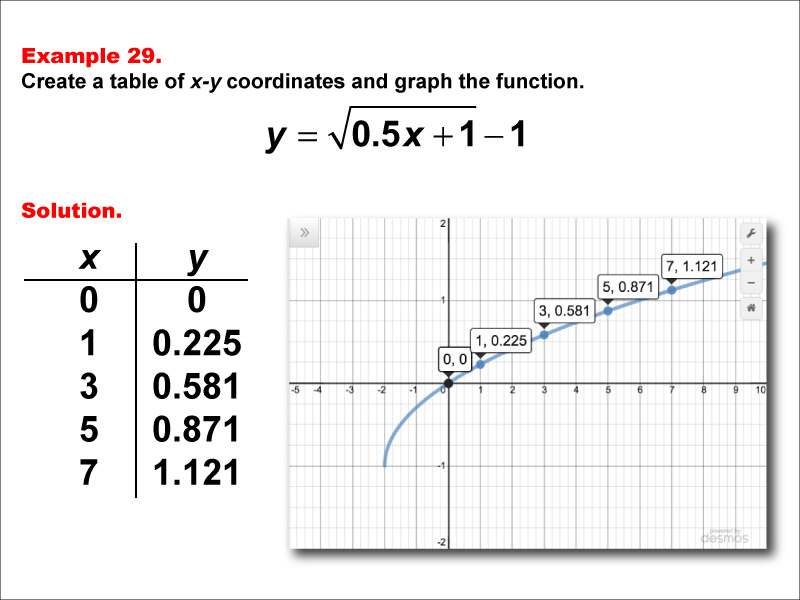
This example illustrates the function y = √(0.5x + 1) - 1. The graph shows an increasing curve starting at (0, 0) and rising gradually as x increases. A table lists x-values (0, 1, 3, 5, and 7) with corresponding y-values of approximately 0, 0.225, 0.581, 0.871, and 1.121.
This example introduces students to square root functions with fractional coefficients inside the radical along with a constant term outside it. It helps them understand how coefficients less than one affect the shape of the graph while maintaining the vertical shift.
Providing multiple examples with different coefficients is essential for developing a deep understanding of square root functions. Each example builds on previous knowledge while challenging students to apply what they've learned in new contexts.
Teacher's Script: Let's examine the function y = √(0.5x + 1) - 1. How do you think this graph will compare to our previous examples? We'll use x-values of 0, 1, 3, 5, and 7 again. Notice how the y-values increase more slowly this time as we plot these points on our graph. Can anyone explain why this happens?
For a complete collection of math examples related to Radical Functions click on this link: Math Examples: Square Root Functions Collection.
| Common Core Standards | CCSS.MATH.CONTENT.HSF.IF.C.7, CCSS.MATH.CONTENT.HSF.IF.C.7.B |
|---|---|
| Grade Range | 9 - 12 |
| Curriculum Nodes |
Algebra • Radical Expressions and Functions • Radical Functions and Equations |
| Copyright Year | 2015 |
| Keywords | function, square root functions, graphs of square root functions, square root function tables |