Display Title
Math Example--Special Functions--Step Functions in Tabular and Graph Form: Example 17
Display Title
Math Example--Special Functions--Step Functions in Tabular and Graph Form: Example 17

Topic
Special Functions
Description
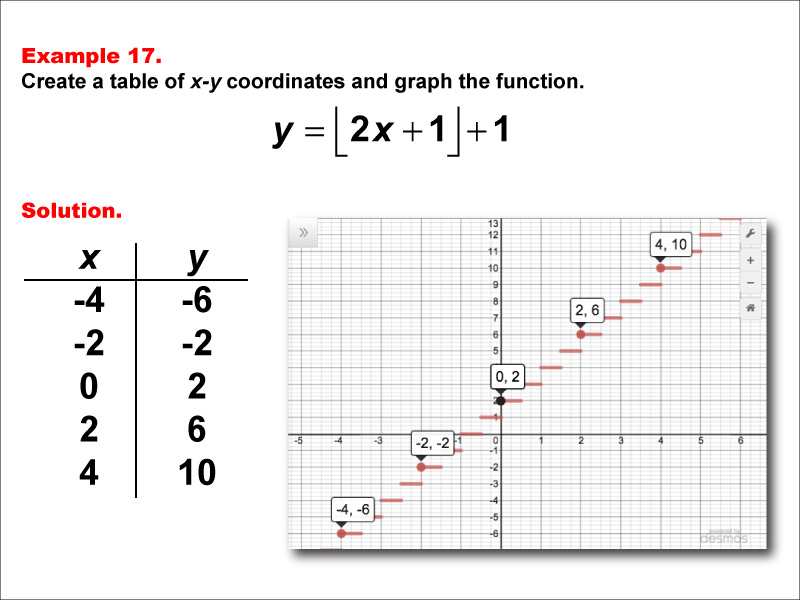
This example demonstrates a step function defined by y = floor(2x + 1) + 1. The graph is plotted with points (-4, -6), (-2, -2), (0, 2), (2, 6), and (4, 10), showing horizontal steps that increase as x increases. This visual representation helps students understand how the function behaves when there's a coefficient greater than 1 inside the floor function.
Step functions are an important concept in mathematics, particularly in the study of special functions. This example aids in teaching the topic by providing a clear visual representation of how the floor function behaves when combined with a linear function with a coefficient greater than 1 and constants both inside and outside the floor function. By examining both the table of coordinates and the corresponding graph, learners can develop a deeper understanding of how step functions behave and how modifications to the equation impact the resulting graph, especially the frequency and height of the steps.
It is crucial for students to see multiple worked-out examples to fully comprehend step functions. This example, in conjunction with others in the collection, highlights different aspects of these functions, such as varying coefficients or additional terms within and outside the floor function. By exploring a range of examples, students can identify patterns, make connections, and build a more comprehensive understanding of step functions and their applications in real-world scenarios.
Teacher's Script: Now, let's look at the step function y = floor(2x + 1) + 1. Compare this to our previous example. What do you notice about the frequency and height of the steps? How has changing the coefficient inside the floor function affected the graph? Pay attention to how the y-values change as x increases. As we continue through more examples, try to predict how changes in both the coefficient and constant inside the floor function, as well as the constant outside, will influence the graph's appearance.
For a complete collection of math examples related to Step Functions click on this link: Math Examples: Step Functions Collection.
| Common Core Standards | CCSS.MATH.CONTENT.HSF.IF.C.7, CCSS.MATH.CONTENT.HSF.IF.C.7.B |
|---|---|
| Grade Range | 9 - 12 |
| Curriculum Nodes |
Algebra • Functions and Relations • Special Functions |
| Copyright Year | 2015 |
| Keywords | function, step functions, graphs of step functions, step function tables, greatest integer function |