Video Transcript: TI-Nspire Mini-Tutorial: Graphing a Scatterplot Using a Graphs and Geometry Window Grade: 6 - 12 Copyright Year 2020 Format PDF
Video Transcript: TI-Nspire Mini-Tutorial: Graphing a Scatterplot Using a Statistics Window Grade: 6 - 12 Copyright Year 2020 Format PDF
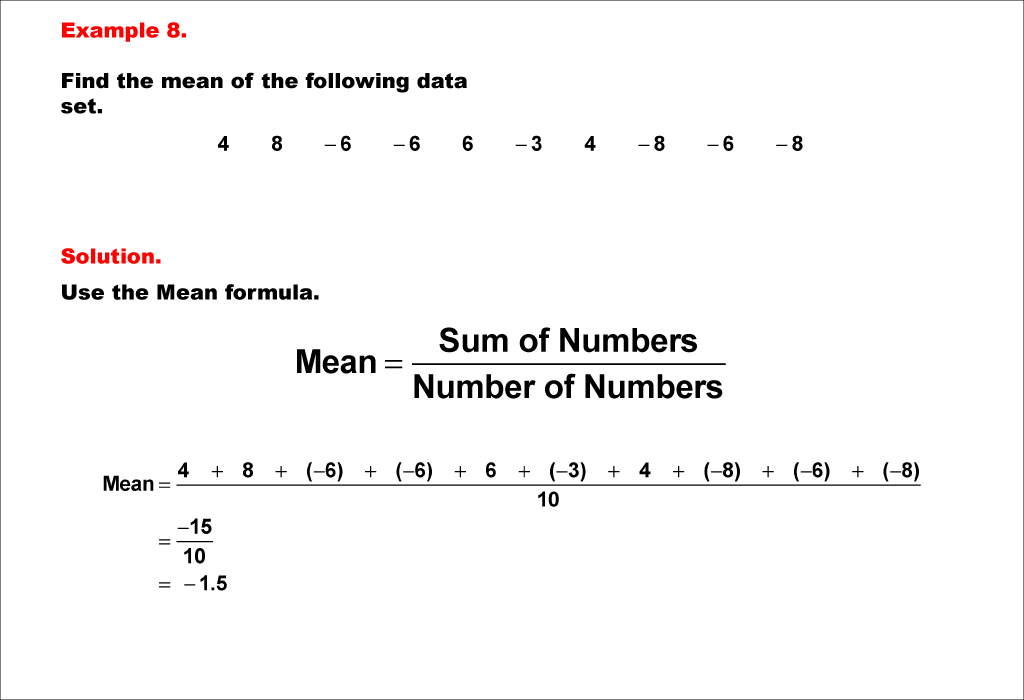
Math Example--Measures of Central Tendency--Mean of Data That Includes Negative Numbers--Example 8 Grade: 6 - 8 Copyright Year 2021 Format Image
Math Example--Measures of Central Tendency--Mean of Data That Includes Negative Numbers--Example 9 Grade: 6 - 8 Copyright Year 2021 Format Image
Math Example--Measures of Central Tendency--Mean of Data That Includes Negative Numbers--Example 10 Grade: 6 - 8 Copyright Year 2021 Format Image
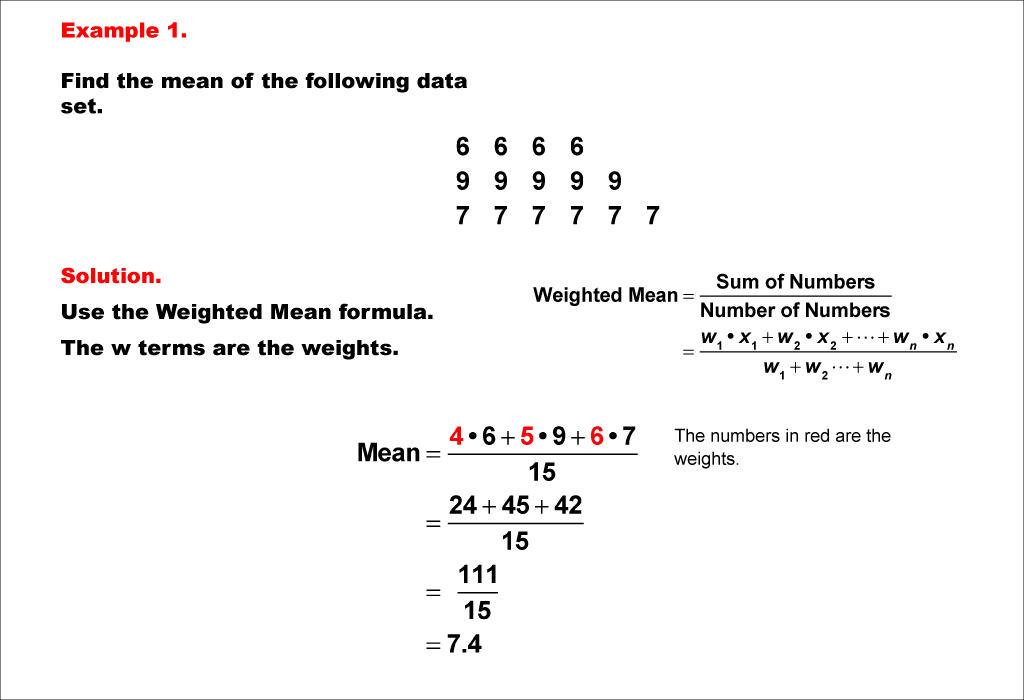
Math Example--Measures of Central Tendency--Weighted Mean--Example 1 Grade: 6 - 8 Copyright Year 2021 Format Image
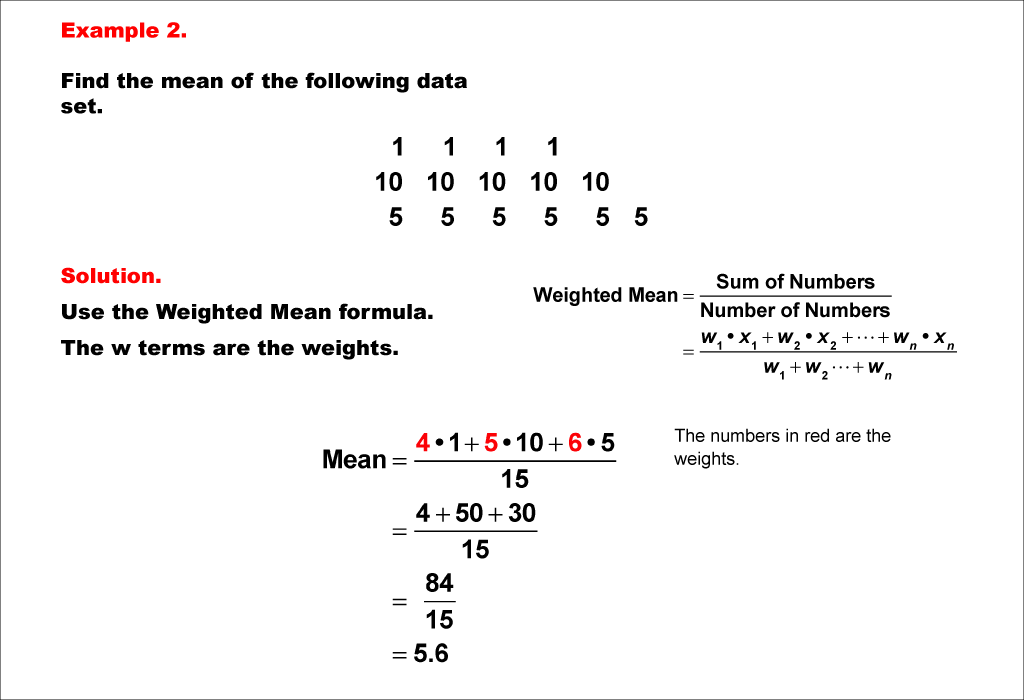
Math Example--Measures of Central Tendency--Weighted Mean--Example 2 Grade: 6 - 8 Copyright Year 2021 Format Image