
These are the resources that support this North Carolina Standard.
NC.7.SP.1 - Understand that statistics can be used to gain information about a population by: Recognizing that generalizations about a population from a sample are valid only if the sample is representative of that population. Using random sampling to produce representative samples to support valid inferences.
Displaying 51 - 64 of 64 resources:
| Thumbnail Image | Title | Description | Curriculum Nodes |
|---|---|---|---|
|
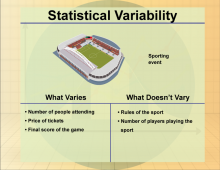
Math Clip Art--Statistics and Probability-- Statistical Variability--8 |
Math Clip Art--Statistics and Probability-- Statistical Variability--8
This is part of a collection of math clip art images that show different statistical graphs and concepts, along with some probability con |
Data Gathering |
|
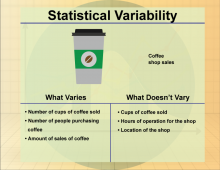
Math Clip Art--Statistics and Probability-- Statistical Variability--9 |
Math Clip Art--Statistics and Probability-- Statistical Variability--9
This is part of a collection of math clip art images that show different statistical graphs and concepts, along with some probability con |
Data Gathering |
|
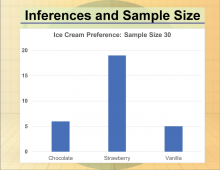
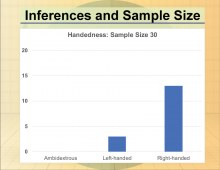
Math Clip Art--Statistics--Inferences and Sample Size--01 |
Math Clip Art--Statistics--Inferences and Sample Size--01
This is part of a collection of math clip art images that show different statistical graphs and concepts, along with some probability concepts. |
Data Gathering |
|
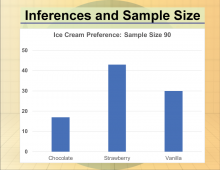
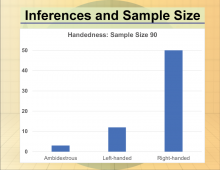
Math Clip Art--Statistics--Inferences and Sample Size--02 |
Math Clip Art--Statistics--Inferences and Sample Size--02
This is part of a collection of math clip art images that show different statistical graphs and concepts, along with some probability concepts. |
Data Gathering |
|
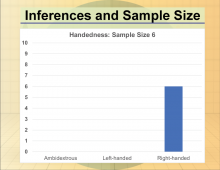
Math Clip Art--Statistics--Inferences and Sample Size--03 |
Math Clip Art--Statistics--Inferences and Sample Size--03
This is part of a collection of math clip art images that show different statistical graphs and concepts, along with some probability concepts. |
Data Gathering |
|
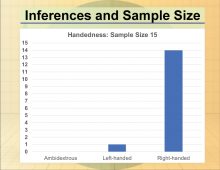
Math Clip Art--Statistics--Inferences and Sample Size--04 |
Math Clip Art--Statistics--Inferences and Sample Size--04
This is part of a collection of math clip art images that show different statistical graphs and concepts, along with some probability concepts. |
Data Gathering |
|
Math Clip Art--Statistics--Inferences and Sample Size--05 |
Math Clip Art--Statistics--Inferences and Sample Size--05
This is part of a collection of math clip art images that show different statistical graphs and concepts, along with some probability concepts. |
Data Gathering |
|
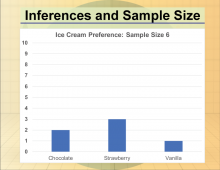
Math Clip Art--Statistics--Inferences and Sample Size--06 |
Math Clip Art--Statistics--Inferences and Sample Size--06
This is part of a collection of math clip art images that show different statistical graphs and concepts, along with some probability concepts. |
Data Gathering |
|
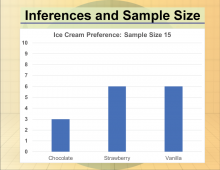
Math Clip Art--Statistics--Inferences and Sample Size--07 |
Math Clip Art--Statistics--Inferences and Sample Size--07
This is part of a collection of math clip art images that show different statistical graphs and concepts, along with some probability concepts. |
Data Gathering |
|
Math Clip Art--Statistics--Inferences and Sample Size--08 |
Math Clip Art--Statistics--Inferences and Sample Size--08
This is part of a collection of math clip art images that show different statistical graphs and concepts, along with some probability concepts. |
Data Gathering |
|
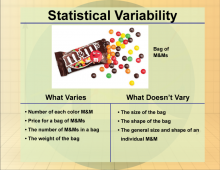
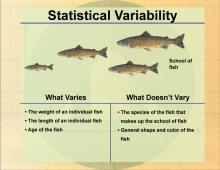
Math Clip Art--Statistics--Statistical Variability--01 |
Math Clip Art--Statistics--Statistical Variability--01
This is part of a collection of math clip art images that show different statistical graphs and concepts, along with some probability concepts. |
Data Gathering |
|
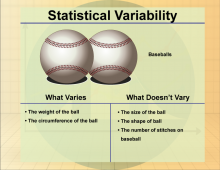
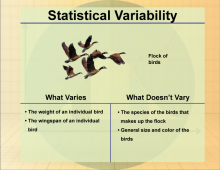
Math Clip Art--Statistics--Statistical Variability--02 |
Math Clip Art--Statistics--Statistical Variability--02
This is part of a collection of math clip art images that show different statistical graphs and concepts, along with some probability concepts. |
Data Gathering |
|
Math Clip Art--Statistics--Statistical Variability--03 |
Math Clip Art--Statistics--Statistical Variability--03
This is part of a collection of math clip art images that show different statistical graphs and concepts, along with some probability concepts. |
Data Gathering |
|
Math Clip Art--Statistics--Statistical Variability--04 |
Math Clip Art--Statistics--Statistical Variability--04
This is part of a collection of math clip art images that show different statistical graphs and concepts, along with some probability concepts. |
Data Gathering |