
These are the resources that support this South Carolina Standard.
3.MDA.3 - Collect, organize, classify, and interpret data with multiple categories and draw a scaled picture graph and a scaled bar graph to represent the data.
Displaying 1 - 32 of 32 resources:
| Thumbnail Image | Title | Description | Curriculum Nodes |
|---|---|---|---|
|
Math Definitions Collection: Charts and Graphs |
This collection aggregates all the definition image cards around the topic of Charts and Graphs. There are a total of 16 terms. | Data Analysis |
|
Math Examples Collection: Charts, Graphs, and Plots |
This collection aggregates all the math examples around the topic of Charts, Graphs, and Plots. There are a total of 38 Math Examples. This collection of resources is made up of downloadable PNG images that you can easily incorporate into your lesson plans. | Slope-Intercept Form, Data Analysis, Point-Slope Form and Subtraction Facts to 100 |

|
Math Examples Collection: Reading Scaled Graphs |
This collection aggregates all the math examples around the topic of Reading Scaled Graphs. There are a total of 13 images. | Subtraction Facts to 100 and Data Analysis |
|
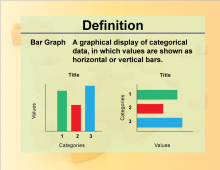
Definition--Charts and Graphs--Bar Graph |
Definition--Charts and Graphs--Bar Graph
This is a collection of definitions related to the concept of charts, graphs, and data displays. |
Data Analysis |
|
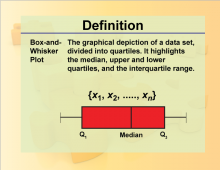
Definition--Charts and Graphs--Box-and-Whisker Plot |
Definition--Charts and Graphs--Box-and-Whisker Plot
This is a collection of definitions related to the concept of charts, graphs, and data displays. |
Data Analysis |
|
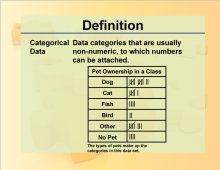
Definition--Charts and Graphs--Categorical Data |
Definition--Charts and Graphs--Categorical Data
This is a collection of definitions related to the concept of charts, graphs, and data displays. |
Data Analysis |
|
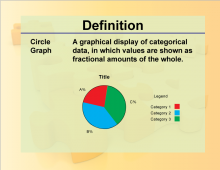
Definition--Charts and Graphs--Circle Graph |
Definition--Charts and Graphs--Circle Graph
This is a collection of definitions related to the concept of charts, graphs, and data displays. |
Data Analysis |
|
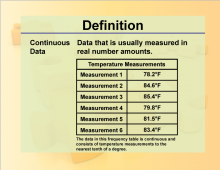
Definition--Charts and Graphs--Continuous Data |
Definition--Charts and Graphs--Continuous Data
This is a collection of definitions related to the concept of charts, graphs, and data displays. |
Data Analysis |
|
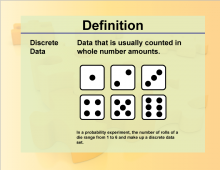
Definition--Charts and Graphs--Discrete Data |
Definition--Charts and Graphs--Discrete Data
This is a collection of definitions related to the concept of charts, graphs, and data displays. |
Data Analysis |
|
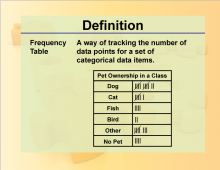
Definition--Charts and Graphs--Frequency Table |
Definition--Charts and Graphs--Frequency Table
This is a collection of definitions related to the concept of charts, graphs, and data displays. |
Data Analysis |
|
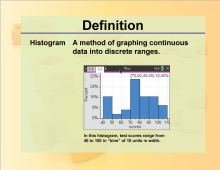
Definition--Charts and Graphs--Histogram |
Definition--Charts and Graphs--Histogram
This is a collection of definitions related to the concept of charts, graphs, and data displays. |
Data Analysis |
|
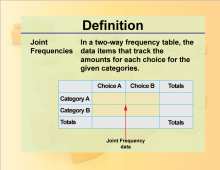
Definition--Charts and Graphs--Joint Frequencies |
Definition--Charts and Graphs--Joint Frequencies
This is a collection of definitions related to the concept of charts, graphs, and data displays. |
Data Analysis |
|
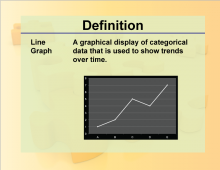
Definition--Charts and Graphs--Line Graph |
Definition--Charts and Graphs--Line Graph
This is a collection of definitions related to the concept of charts, graphs, and data displays. |
Data Analysis |
|
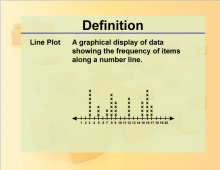
Definition--Charts and Graphs--Line Plot |
Definition--Charts and Graphs--Line Plot
This is a collection of definitions related to the concept of charts, graphs, and data displays. |
Data Analysis |
|
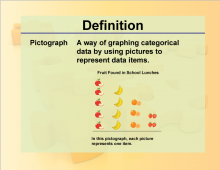
Definition--Charts and Graphs--Pictograph |
Definition--Charts and Graphs--Pictograph
This is a collection of definitions related to the concept of charts, graphs, and data displays. |
Data Analysis |
|
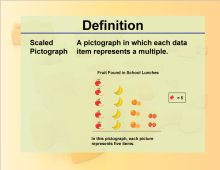
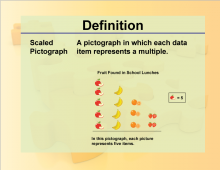
Definition--Charts and Graphs--Scaled Pictograph |
Definition--Charts and Graphs--Scaled Pictograph
This is a collection of definitions related to the concept of charts, graphs, and data displays. |
Data Analysis |
|
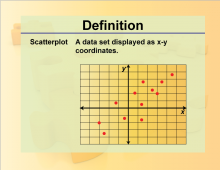
Definition--Charts and Graphs--Scatterplot |
Definition--Charts and Graphs--Scatterplot
This is a collection of definitions related to the concept of charts, graphs, and data displays. |
Data Analysis |
|
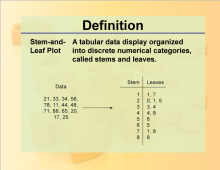
Definition--Charts and Graphs--Stem-and-Leaf Plot |
Definition--Charts and Graphs--Stem-and-Leaf Plot
This is a collection of definitions related to the concept of charts, graphs, and data displays. |
Data Analysis |
|
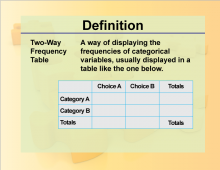
Definition--Charts and Graphs--Two-Way Frequency Table |
Definition--Charts and Graphs--Two-Way Frequency Table
This is a collection of definitions related to the concept of charts, graphs, and data displays. |
Data Analysis |

|
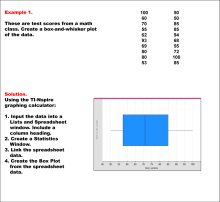
Math Example--Charts, Graphs, and Plots--Reading and Interpreting Scaled Graphs--Example 1 |
Math Example--Charts, Graphs, and Plots-- Reading and Interpreting Scaled Graphs--Example 1
In this set of math examples, analyze the behavior of different scatterplots. |
Subtraction Facts to 100 and Data Analysis |
|
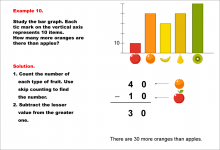
Math Example--Charts, Graphs, and Plots--Reading and Interpreting Scaled Graphs--Example 10 |
Math Example--Charts, Graphs, and Plots-- Reading and Interpreting Scaled Graphs--Example 10
In this set of math examples, analyze the behavior of different scatterplots. |
Subtraction Facts to 100 and Data Analysis |
|
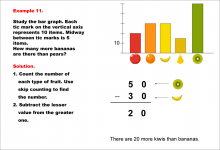
Math Example--Charts, Graphs, and Plots--Reading and Interpreting Scaled Graphs--Example 11 |
Math Example--Charts, Graphs, and Plots-- Reading and Interpreting Scaled Graphs--Example 11
In this set of math examples, analyze the behavior of different scatterplots. |
Subtraction Facts to 100 and Data Analysis |
|
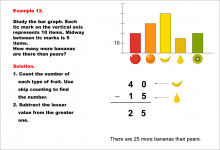
Math Example--Charts, Graphs, and Plots--Reading and Interpreting Scaled Graphs--Example 12 |
Math Example--Charts, Graphs, and Plots-- Reading and Interpreting Scaled Graphs--Example 12
In this set of math examples, analyze the behavior of different scatterplots. |
Subtraction Facts to 100 and Data Analysis |
|
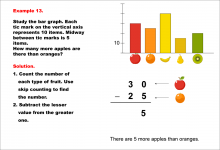
Math Example--Charts, Graphs, and Plots--Reading and Interpreting Scaled Graphs--Example 13 |
Math Example--Charts, Graphs, and Plots-- Reading and Interpreting Scaled Graphs--Example 13
In this set of math examples, analyze the behavior of different scatterplots. |
Subtraction Facts to 100 and Data Analysis |
|
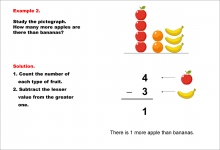
Math Example--Charts, Graphs, and Plots--Reading and Interpreting Scaled Graphs--Example 2 |
Math Example--Charts, Graphs, and Plots-- Reading and Interpreting Scaled Graphs--Example 2
In this set of math examples, analyze the behavior of different scatterplots. |
Subtraction Facts to 100 and Data Analysis |
|
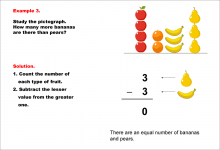
Math Example--Charts, Graphs, and Plots--Reading and Interpreting Scaled Graphs--Example 3 |
Math Example--Charts, Graphs, and Plots-- Reading and Interpreting Scaled Graphs--Example 3
In this set of math examples, analyze the behavior of different scatterplots. |
Subtraction Facts to 100 and Data Analysis |
|
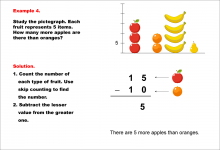
Math Example--Charts, Graphs, and Plots--Reading and Interpreting Scaled Graphs--Example 4 |
Math Example--Charts, Graphs, and Plots-- Reading and Interpreting Scaled Graphs--Example 4
In this set of math examples, analyze the behavior of different scatterplots. |
Subtraction Facts to 100 and Data Analysis |
|
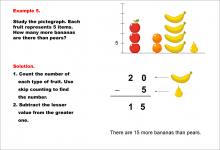
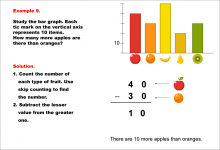
Math Example--Charts, Graphs, and Plots--Reading and Interpreting Scaled Graphs--Example 5 |
Math Example--Charts, Graphs, and Plots-- Reading and Interpreting Scaled Graphs--Example 5
In this set of math examples, analyze the behavior of different scatterplots. |
Subtraction Facts to 100 and Data Analysis |
|
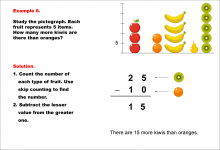
Math Example--Charts, Graphs, and Plots--Reading and Interpreting Scaled Graphs--Example 6 |
Math Example--Charts, Graphs, and Plots-- Reading and Interpreting Scaled Graphs--Example 6
In this set of math examples, analyze the behavior of different scatterplots. |
Subtraction Facts to 100 and Data Analysis |
|
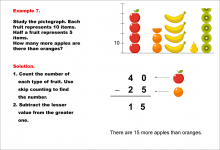
Math Example--Charts, Graphs, and Plots--Reading and Interpreting Scaled Graphs--Example 7 |
Math Example--Charts, Graphs, and Plots-- Reading and Interpreting Scaled Graphs--Example 7
In this set of math examples, analyze the behavior of different scatterplots. |
Subtraction Facts to 100 and Data Analysis |
|
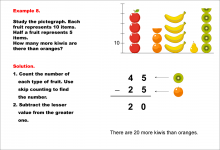
Math Example--Charts, Graphs, and Plots--Reading and Interpreting Scaled Graphs--Example 8 |
Math Example--Charts, Graphs, and Plots-- Reading and Interpreting Scaled Graphs--Example 8
In this set of math examples, analyze the behavior of different scatterplots. |
Subtraction Facts to 100 and Data Analysis |
|
Math Example--Charts, Graphs, and Plots--Reading and Interpreting Scaled Graphs--Example 9 |
Math Example--Charts, Graphs, and Plots-- Reading and Interpreting Scaled Graphs--Example 9
In this set of math examples, analyze the behavior of different scatterplots. |
Subtraction Facts to 100 and Data Analysis |