
These are the resources that support this South Carolina Standard.
K.MDA.3 - Sort and classify data into 2 or 3 categories with data not to exceed 20 items in each category.
Displaying 1 - 4 of 4 resources:
| Thumbnail Image | Title | Description | Curriculum Nodes |
|---|---|---|---|
|
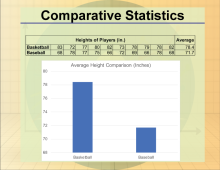
Math Clip Art Collection: Statistics |
This collection aggregates all the math clip art around the topic of Statistics. There are a total of 55 images. | Data Analysis, Probability, Data Gathering and Counting |
|
Math Clip Art--Statistics--Fruit Pictograph-1 |
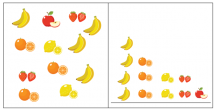
Math Clip Art--Statistics--Fruit Pictograph-1
This is part of a collection of math clip art images that show different statistical graphs and concepts, along with some probability concepts. |
Counting |
|
Math Clip Art--Statistics--Fruit Pictograph-2 |
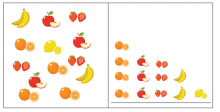
Math Clip Art--Statistics--Fruit Pictograph-2
This is part of a collection of math clip art images that show different statistical graphs and concepts, along with some probability concepts. |
Counting |
|
Math Clip Art--Statistics--Fruit Pictograph-3 |
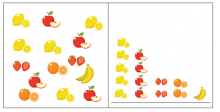
Math Clip Art--Statistics--Fruit Pictograph-3
This is part of a collection of math clip art images that show different statistical graphs and concepts, along with some probability concepts. |
Counting |