
These are the resources that support this TEKS Standard.
TEKS.6.12a - Represent numeric data graphically, including dot plots, stem-and-leaf plots, histograms, and box plots.
Displaying 51 - 100 of 202 resources:
| Thumbnail Image | Title | Description | Curriculum Nodes |
|---|---|---|---|

|
Interactive Math Game--DragNDrop--Linear Functions |
Interactive Math Game--DragNDrop Math--Linear Functions
In this drag-and-drop game, match the linear function in slope-intercept form with its description. |
Applications of Linear Functions |
|
Interactive Math Game--DragNDrop--Linear Functions in Standard Form |
Interactive Math Game--DragNDrop Math--Linear Functions in Standard Form
In this drag-and-drop game, match the linear function in standard form with its slope-intercept counterpart. |
Standard Form |

|
Interactive Word Search Puzzle--Data Analysis, Puzzle 1 |
Interactive Word Search Puzzle--Data Analysis, Puzzle 1
Solve an interactive word search puzzle on the topic of Data Analysis. |
Data Analysis |

|
Interactive Word Search Puzzle--Data Analysis, Puzzle 2 |
Interactive Word Search Puzzle--Data Analysis, Puzzle 2
Solve an interactive word search puzzle on the topic of Data Analysis. |
Data Analysis |

|
Interactive Word Search Puzzle--Data Analysis, Puzzle 3 |
Interactive Word Search Puzzle--Data Analysis, Puzzle 3
Solve an interactive word search puzzle on the topic of Data Analysis. |
Data Analysis |

|
Interactive Word Search Puzzle--Data Analysis, Puzzle 4 |
Interactive Word Search Puzzle--Data Analysis, Puzzle 4
Solve an interactive word search puzzle on the topic of Data Analysis. |
Data Analysis |
|
Interactive Word Search Puzzle--Data Analysis, Puzzle 5 |
Interactive Word Search Puzzle--Data Analysis, Puzzle 5
Solve an interactive word search puzzle on the topic of Data Analysis. |
Data Analysis |

|
Math Clip Art--Statistics and Probability--Basic Line Plot |
Math Clip Art--Statistics and Probability--Basic Line Plot
This is part of a collection of math clip art images that show different statistical graphs and concepts, along with some probability concepts. |
Length |
|
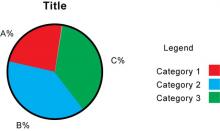
Math Clip Art--Statistics and Probability--Circle Graph |
Math Clip Art--Statistics and Probability--Circle Graph
This is part of a collection of math clip art images that show different statistical graphs and concepts, along with some probability concepts. |
Data Analysis |
|
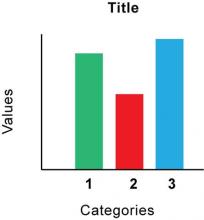
Math Clip Art--Statistics--Bar Graph |
Math Clip Art--Statistics--Bar Graph
This is part of a collection of math clip art images that show different statistical graphs and concepts, along with some probability concepts. |
Data Analysis |
|
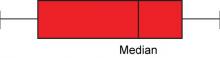
Math Clip Art--Statistics--Box and Whisker Plot |
Math Clip Art--Statistics--Box and Whisker Plot
This is part of a collection of math clip art images that show different statistical graphs and concepts, along with some probability concepts. |
Data Analysis |
|
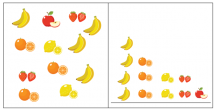
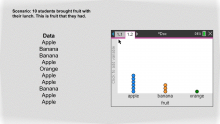
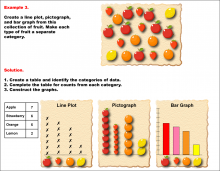
Math Clip Art--Statistics--Fruit Pictograph-1 |
Math Clip Art--Statistics--Fruit Pictograph-1
This is part of a collection of math clip art images that show different statistical graphs and concepts, along with some probability concepts. |
Counting |
|
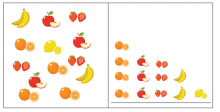
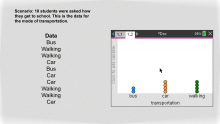
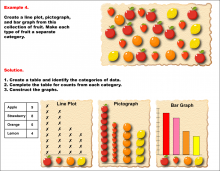
Math Clip Art--Statistics--Fruit Pictograph-2 |
Math Clip Art--Statistics--Fruit Pictograph-2
This is part of a collection of math clip art images that show different statistical graphs and concepts, along with some probability concepts. |
Counting |
|
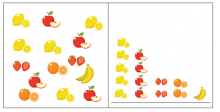
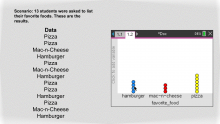
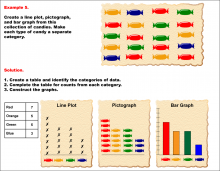
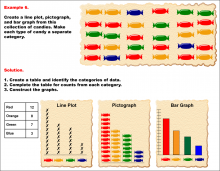
Math Clip Art--Statistics--Fruit Pictograph-3 |
Math Clip Art--Statistics--Fruit Pictograph-3
This is part of a collection of math clip art images that show different statistical graphs and concepts, along with some probability concepts. |
Counting |
|
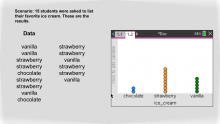
Math Clip Art--Statistics--Line Plots with Data--01 |
Math Clip Art--Statistics--Line Plots with Data--01
This is part of a collection of math clip art images that show different statistical graphs and concepts, along with some probability concepts. |
Data Analysis |
|
Math Clip Art--Statistics--Line Plots with Data--02 |
Math Clip Art--Statistics--Line Plots with Data--02
This is part of a collection of math clip art images that show different statistical graphs and concepts, along with some probability concepts. |
Data Analysis |
|
Math Clip Art--Statistics--Line Plots with Data--03 |
Math Clip Art--Statistics--Line Plots with Data--03
This is part of a collection of math clip art images that show different statistical graphs and concepts, along with some probability concepts. |
Data Analysis |
|
Math Clip Art--Statistics--Line Plots with Data--04 |
Math Clip Art--Statistics--Line Plots with Data--04
This is part of a collection of math clip art images that show different statistical graphs and concepts, along with some probability concepts. |
Data Analysis |
|
Math Clip Art--Statistics--Line Plots with Data--05 |
Math Clip Art--Statistics--Line Plots with Data--05
This is part of a collection of math clip art images that show different statistical graphs and concepts, along with some probability concepts. |
Data Analysis |
|
Math Clip Art--Statistics--Line Plots with Data--06 |
Math Clip Art--Statistics--Line Plots with Data--06
This is part of a collection of math clip art images that show different statistical graphs and concepts, along with some probability concepts. |
Data Analysis |
|
Math Clip Art--Statistics--Line Plots with Data--07 |
Math Clip Art--Statistics--Line Plots with Data--07
This is part of a collection of math clip art images that show different statistical graphs and concepts, along with some probability concepts. |
Data Analysis |
|
Math Clip Art--Statistics--Line Plots with Data--08 |
Math Clip Art--Statistics--Line Plots with Data--08
This is part of a collection of math clip art images that show different statistical graphs and concepts, along with some probability concepts. |
Data Analysis |
|
Math Clip Art--Statistics--Line Plots with Data--09 |
Math Clip Art--Statistics--Line Plots with Data--09
This is part of a collection of math clip art images that show different statistical graphs and concepts, along with some probability concepts. |
Data Analysis |
|
Math Clip Art--Statistics--Line Plots with Data--10 |
Math Clip Art--Statistics--Line Plots with Data--10
This is part of a collection of math clip art images that show different statistical graphs and concepts, along with some probability concepts. |
Data Analysis |
|
Math Example--Charts, Graphs, and Plots--Data Plot--Example 1 |
Math Example--Charts, Graphs, and Plots-- Data Plot--Example 1
In this set of math examples, analyze the behavior of different scatterplots. This includes linear and quadratic models. |
Data Analysis |
|
Math Example--Charts, Graphs, and Plots--Data Plot--Example 2 |
Math Example--Charts, Graphs, and Plots-- Data Plot--Example 2
In this set of math examples, analyze the behavior of different scatterplots. This includes linear and quadratic models. |
Data Analysis |
|
Math Example--Charts, Graphs, and Plots--Data Plot--Example 3 |
Math Example--Charts, Graphs, and Plots-- Data Plot--Example 3
In this set of math examples, analyze the behavior of different scatterplots. This includes linear and quadratic models. |
Data Analysis |
|
Math Example--Charts, Graphs, and Plots--Data Plot--Example 4 |
Math Example--Charts, Graphs, and Plots-- Data Plot--Example 4
In this set of math examples, analyze the behavior of different scatterplots. This includes linear and quadratic models. |
Data Analysis |
|
Math Example--Charts, Graphs, and Plots--Graphs of Categorical Data--Example 1 |
Math Example--Charts, Graphs, and Plots-- Graphs of Categorical Data--Example 1
In this set of math examples, analyze the behavior of different scatterplots. This includes linear and quadratic models. |
Data Analysis |
|
Math Example--Charts, Graphs, and Plots--Graphs of Categorical Data--Example 2 |
Math Example--Charts, Graphs, and Plots-- Graphs of Categorical Data--Example 2
In this set of math examples, analyze the behavior of different scatterplots. This includes linear and quadratic models. |
Data Analysis |
|
Math Example--Charts, Graphs, and Plots--Graphs of Categorical Data--Example 3 |
Math Example--Charts, Graphs, and Plots-- Graphs of Categorical Data--Example 3
In this set of math examples, analyze the behavior of different scatterplots. This includes linear and quadratic models. |
Data Analysis |
|
Math Example--Charts, Graphs, and Plots--Graphs of Categorical Data--Example 4 |
Math Example--Charts, Graphs, and Plots-- Graphs of Categorical Data--Example 4
In this set of math examples, analyze the behavior of different scatterplots. This includes linear and quadratic models. |
Data Analysis |
|
Math Example--Charts, Graphs, and Plots--Graphs of Categorical Data--Example 5 |
Math Example--Charts, Graphs, and Plots-- Graphs of Categorical Data--Example 5
In this set of math examples, analyze the behavior of different scatterplots. This includes linear and quadratic models. |
Data Analysis |
|
Math Example--Charts, Graphs, and Plots--Graphs of Categorical Data--Example 6 |
Math Example--Charts, Graphs, and Plots-- Graphs of Categorical Data--Example 6
In this set of math examples, analyze the behavior of different scatterplots. This includes linear and quadratic models. |
Data Analysis |

|
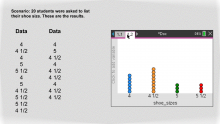
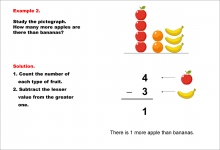
Math Example--Charts, Graphs, and Plots--Reading and Interpreting Scaled Graphs--Example 1 |
Math Example--Charts, Graphs, and Plots-- Reading and Interpreting Scaled Graphs--Example 1
In this set of math examples, analyze the behavior of different scatterplots. |
Subtraction Facts to 100 and Data Analysis |
|
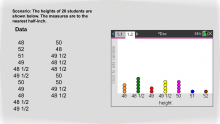
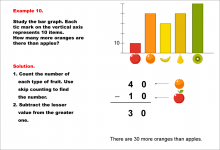
Math Example--Charts, Graphs, and Plots--Reading and Interpreting Scaled Graphs--Example 10 |
Math Example--Charts, Graphs, and Plots-- Reading and Interpreting Scaled Graphs--Example 10
In this set of math examples, analyze the behavior of different scatterplots. |
Subtraction Facts to 100 and Data Analysis |
|
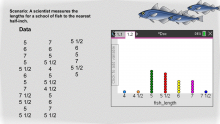
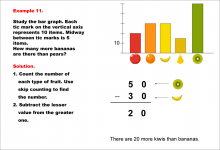
Math Example--Charts, Graphs, and Plots--Reading and Interpreting Scaled Graphs--Example 11 |
Math Example--Charts, Graphs, and Plots-- Reading and Interpreting Scaled Graphs--Example 11
In this set of math examples, analyze the behavior of different scatterplots. |
Subtraction Facts to 100 and Data Analysis |
|
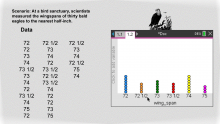
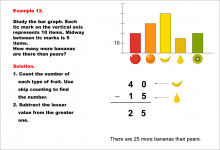
Math Example--Charts, Graphs, and Plots--Reading and Interpreting Scaled Graphs--Example 12 |
Math Example--Charts, Graphs, and Plots-- Reading and Interpreting Scaled Graphs--Example 12
In this set of math examples, analyze the behavior of different scatterplots. |
Subtraction Facts to 100 and Data Analysis |
|
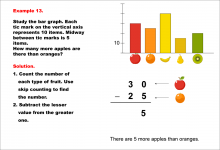
Math Example--Charts, Graphs, and Plots--Reading and Interpreting Scaled Graphs--Example 13 |
Math Example--Charts, Graphs, and Plots-- Reading and Interpreting Scaled Graphs--Example 13
In this set of math examples, analyze the behavior of different scatterplots. |
Subtraction Facts to 100 and Data Analysis |
|
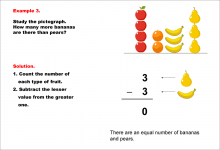
Math Example--Charts, Graphs, and Plots--Reading and Interpreting Scaled Graphs--Example 2 |
Math Example--Charts, Graphs, and Plots-- Reading and Interpreting Scaled Graphs--Example 2
In this set of math examples, analyze the behavior of different scatterplots. |
Subtraction Facts to 100 and Data Analysis |
|
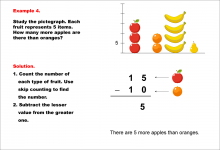
Math Example--Charts, Graphs, and Plots--Reading and Interpreting Scaled Graphs--Example 3 |
Math Example--Charts, Graphs, and Plots-- Reading and Interpreting Scaled Graphs--Example 3
In this set of math examples, analyze the behavior of different scatterplots. |
Subtraction Facts to 100 and Data Analysis |
|
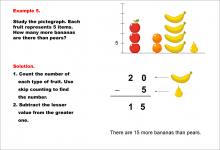
Math Example--Charts, Graphs, and Plots--Reading and Interpreting Scaled Graphs--Example 4 |
Math Example--Charts, Graphs, and Plots-- Reading and Interpreting Scaled Graphs--Example 4
In this set of math examples, analyze the behavior of different scatterplots. |
Subtraction Facts to 100 and Data Analysis |
|
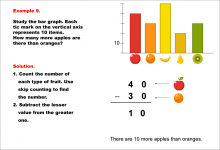
Math Example--Charts, Graphs, and Plots--Reading and Interpreting Scaled Graphs--Example 5 |
Math Example--Charts, Graphs, and Plots-- Reading and Interpreting Scaled Graphs--Example 5
In this set of math examples, analyze the behavior of different scatterplots. |
Subtraction Facts to 100 and Data Analysis |
|
Math Example--Charts, Graphs, and Plots--Reading and Interpreting Scaled Graphs--Example 6 |
Math Example--Charts, Graphs, and Plots-- Reading and Interpreting Scaled Graphs--Example 6
In this set of math examples, analyze the behavior of different scatterplots. |
Subtraction Facts to 100 and Data Analysis |
|
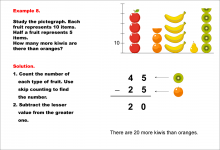
Math Example--Charts, Graphs, and Plots--Reading and Interpreting Scaled Graphs--Example 7 |
Math Example--Charts, Graphs, and Plots-- Reading and Interpreting Scaled Graphs--Example 7
In this set of math examples, analyze the behavior of different scatterplots. |
Subtraction Facts to 100 and Data Analysis |
|
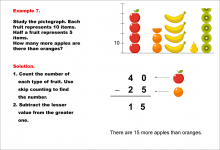
Math Example--Charts, Graphs, and Plots--Reading and Interpreting Scaled Graphs--Example 8 |
Math Example--Charts, Graphs, and Plots-- Reading and Interpreting Scaled Graphs--Example 8
In this set of math examples, analyze the behavior of different scatterplots. |
Subtraction Facts to 100 and Data Analysis |
|
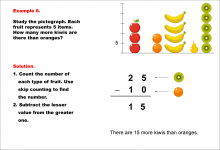
Math Example--Charts, Graphs, and Plots--Reading and Interpreting Scaled Graphs--Example 9 |
Math Example--Charts, Graphs, and Plots-- Reading and Interpreting Scaled Graphs--Example 9
In this set of math examples, analyze the behavior of different scatterplots. |
Subtraction Facts to 100 and Data Analysis |

|
MATH EXAMPLES--The Mean |
MATH EXAMPLES--The Mean
This set of tutorials provides 42 examples of calculating the mean. NOTE: The download is a PPT file. |
Data Analysis |
|
|
MATH EXAMPLES--The Median |
MATH EXAMPLES--The Median
This set of tutorials provides 40 examples of calculating the median. NOTE: The download is a PPT file. |
Data Analysis |
|
|
MATH EXAMPLES--The Mode |
MATH EXAMPLES--The Mode
This set of tutorials provides 78 examples of calculating the mode. NOTE: The download is a PPT file. |
Data Analysis |