
These are the resources that support this TEKS Standard.
TEKS.6.12d - Summarize categorical data with numerical and graphical summaries, including the mode, the percent of values in each category (relative frequency table), and the percent bar graph, and use these summaries to describe the data distribution.
Displaying 251 - 286 of 286 resources:
| Thumbnail Image | Title | Description | Curriculum Nodes |
|---|---|---|---|
|
Math in the News: Issue 90--America's Candy Crush |
Math in the News: Issue 90--America's Candy Crush
February 2014. In this issue of Math in the News we look at economic data around Valentine's Day purchases. |
Data Analysis |
|
Math in the News: Issue 93--Saving for College |
Math in the News: Issue 93--Saving for College
February 2014. In this issue of Math in the News we look at the investment strategy known as Dollar Cost Averaging. |
Data Analysis |
|
Math in the News: Issue 94--Florida's Orange Crop |
Math in the News: Issue 94--Winter's Impact on Florida's Orange Crop
March 2014. In this issue of Math in the News we look at the impact of a harsh winter on Florida's orange crop. |
Data Analysis |
|
Math in the News: Issue 95--The Iditarod Race |
Math in the News: Issue 95--The Iditarod Race
March 2014. In this issue of Math in the News we look at the Iditarod Race in Alaska. This gives us an opportunity to analyze data on average speed. |
Data Analysis |

|
Video Transcript: Algebra Applications: Data Analysis |
Video Transcript: Algebra Applications: Data Analysis
This is the transcript for the video of same title. |
Data Analysis |
|
|
Video Transcript: Algebra Applications: Data Analysis, Segment 1: Introduction |
Video Transcript: Algebra Applications: Data Analysis, Segment 1: Introduction
This is the transcript for the video of same title. |
Data Analysis |
|
|
Video Transcript: Algebra Applications: Data Analysis, Segment 2: What Is a Mortgage? |
Video Transcript: Algebra Applications: Data Analysis, Segment 2: What Is a Mortgage?
This is the transcript for the video of same title. Video contents: The time value of money is at the basis of all loans. |
Data Analysis |
|
|
Video Transcript: Algebra Applications: Data Analysis, Segment 3: What is a Subprime Mortgage? |
Video Transcript: Algebra Applications: Data Analysis, Segment 3: What is a Subprime Mortgage?
This is the transcript for the video of same title. |
Data Analysis |
|
|
Video Transcript: Algebra Applications: Data Analysis, Segment 4: What is an Adjustable Rate Mortgage? |
Video Transcript: Algebra Applications: Data Analysis, Segment 4: What is an Adjustable Rate Mortgage?
This is the transcript for the video of same title. |
Data Analysis |
|
|
Video Transcript: Algebra Nspirations: Data Analysis and Probability |
Video Transcript: Algebra Nspirations: Data Analysis and Probability
This is the transcript for the video of same title. Video contents: What are the two meanings of statistics? |
Data Analysis |
|
|
Video Transcript: Algebra Nspirations: Data Analysis and Probability, 1 |
Video Transcript: Algebra Nspirations: Data Analysis and Probability, Part 1
This is the transcript for the video of same title. |
Data Analysis |
|
|
Video Transcript: Algebra Nspirations: Data Analysis and Probability, 2 |
Video Transcript: Algebra Nspirations: Data Analysis and Probability, Part 2
This is the transcript for the video of same title. |
Data Analysis |
|
|
Video Transcript: TI-Nspire Mini-Tutorial: Creating a Histogram |
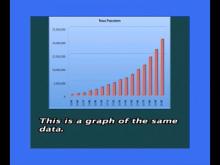
Video Transcript: TI-Nspire Mini-Tutorial: Creating a Histogram
This is the transcript for the TI-Nspire Mini-Tutorial entitled, Creating a Histogram. |
Data Analysis |
|
|
Video Transcript: TI-Nspire Mini-Tutorial: Creating a Random Number Table |
Video Transcript: TI-Nspire Mini-Tutorial: Creating a Random Number Table
This is the transcript for the TI-Nspire Mini-Tutorial entitled, Creating a Random Number Table. |
Probability |
|
VIDEO: Algebra Applications: Data Analysis |
VIDEO: Algebra Applications: Data Analysis
In this episode of Algebra Applications, students explore the dramatic events of 2008 related to the mortgage crisis. |
Data Analysis and Data Gathering |
|
VIDEO: Algebra Applications: Data Analysis, 1 |
VIDEO: Algebra Applications: Data Analysis, Segment 1: Introduction
In this introductory segment students learn about the mortage crisis of 2008. |
Data Analysis and Data Gathering |
|
VIDEO: Algebra Applications: Data Analysis, 2 |
VIDEO: Algebra Applications: Data Analysis, Segment 2: What Is a Mortgage?
The time value of money is at the basis of all loans. |
Data Analysis and Data Gathering |
|
VIDEO: Algebra Applications: Data Analysis, 3 |
VIDEO: Algebra Applications: Data Analysis, Segment 3: What Is a What is a Subprime Mortgage?
Having learned the general features of a mortgage, students learn the specifics of a subprime mortgage. |
Data Analysis and Data Gathering |
|
VIDEO: Algebra Applications: Data Analysis, 4 |
VIDEO: Algebra Applications: Data Analysis, Segment 4: What is an Adjustable Rate Mortgage?
Another factor in the mortgage crisis was the use of adjustable rate mortgages. |
Data Analysis and Data Gathering |
|
VIDEO: Algebra Nspirations: Data Analysis and Probability |
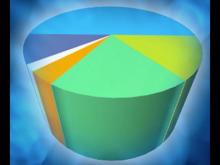
VIDEO: Algebra Nspirations: Data Analysis and Probability
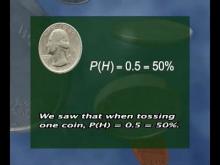
What are the two meanings of statistics? What does it really mean that an event has a 50% probability of occurring? |
Data Analysis and Data Gathering |
|
VIDEO: Algebra Nspirations: Data Analysis and Probability, 1 |
VIDEO: Algebra Nspirations: Data Analysis and Probability, Segment 1
What are the two meanings of statistics? What does it really mean that an event has a 50% probability of occurring? |
Data Analysis and Data Gathering |
|
VIDEO: Algebra Nspirations: Data Analysis and Probability, 2 |
VIDEO: Algebra Nspirations: Data Analysis and Probability, Segment 2
What are the two meanings of statistics? What does it really mean that an event has a 50% probability of occurring? |
Data Analysis and Data Gathering |
|
VIDEO: Algebra Nspirations: Data Analysis and Probability, 3 |
VIDEO: Algebra Nspirations: Data Analysis and Probability, Segment 3
What are the two meanings of statistics? What does it really mean that an event has a 50% probability of occurring? |
Data Analysis and Data Gathering |
|
VIDEO: Algebra Nspirations: Data Analysis and Probability, 4 |
VIDEO: Algebra Nspirations: Data Analysis and Probability, Segment 4
What are the two meanings of statistics? What does it really mean that an event has a 50% probability of occurring? |
Data Analysis and Data Gathering |
|
VIDEO: Ti-Nspire Mini-Tutorial, Video 55 |
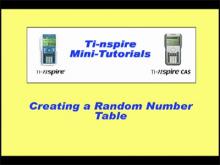
VIDEO: TI-Nspire Mini-Tutorial: Creating a Random Number Table
In this TI Nspire tutorial, the Spreadsheet window is used to create a random number table. |
Probability |
|
Worksheet: TI-Nspire Mini-Tutorial: Creating a Histogram |
Worksheet: TI-Nspire Mini-Tutorial: Creating a Histogram
This is part of a collection of math worksheets on the use of the TI-Nspire graphing calculator. |
Data Analysis |
|
|
Worksheet: TI-Nspire Mini-Tutorial: Creating a Random Number Table |
Worksheet: TI-Nspire Mini-Tutorial: Creating a Random Number Table
This is part of a collection of math worksheets on the use of the TI-Nspire graphing calculator. |
Probability |
|
|
Worksheet: TI-Nspire Mini-Tutorial: Graphing a Box-and-Whisker Plot |
Worksheet: TI-Nspire Mini-Tutorial: Graphing a Box-and-Whisker Plot
This is part of a collection of math worksheets on the use of the TI-Nspire graphing calculator. |
Data Analysis |
|
Worksheet: TI-Nspire Mini-Tutorial: Graphing a Multiseries Scatterplot Using a Graphs and Geometry Window |
Worksheet: TI-Nspire Mini-Tutorial: Graphing a Multiseries Scatterplot Using a Graphs and Geometry Window
This is part of a collection of math worksheets on the use of the TI-Nspire graphing calculator. |
Data Analysis |
|
|
Worksheet: TI-Nspire Mini-Tutorial: Graphing a Scatterplot Using a Graphs and Geometry Window |
Worksheet: TI-Nspire Mini-Tutorial: Graphing a Scatterplot Using a Graphs and Geometry Window
This is part of a collection of math worksheets on the use of the TI-Nspire graphing calculator. |
Data Analysis |
|
|
Worksheet: TI-Nspire Mini-Tutorial: Graphing a Scatterplot Using a Statistics Window |
Worksheet: TI-Nspire Mini-Tutorial: Graphing a Scatterplot Using a Statistics Window
This is part of a collection of math worksheets on the use of the TI-Nspire graphing calculator. |
Data Analysis |
|
WORKSHEET: Word Search Puzzle--Data Analysis, Puzzle 1 |
WORKSHEET: Word Search Puzzle--Data Analysis, Puzzle 1
Solve a word search puzzle on the topic of Data Analysis. |
Data Analysis |
|
|
WORKSHEET: Word Search Puzzle--Data Analysis, Puzzle 2 |
WORKSHEET: Word Search Puzzle--Data Analysis, Puzzle 2
Solve a word search puzzle on the topic of Data Analysis. |
Data Analysis |
|
|
WORKSHEET: Word Search Puzzle--Data Analysis, Puzzle 3 |
WORKSHEET: Word Search Puzzle--Data Analysis, Puzzle 3
Solve a word search puzzle on the topic of Data Analysis. |
Data Analysis |
|
|
WORKSHEET: Word Search Puzzle--Data Analysis, Puzzle 4 |
WORKSHEET: Word Search Puzzle--Data Analysis, Puzzle 4
Solve a word search puzzle on the topic of Data Analysis. |
Data Analysis |
|
|
WORKSHEET: Word Search Puzzle--Data Analysis, Puzzle 5 |
WORKSHEET: Word Search Puzzle--Data Analysis, Puzzle 5
Solve a word search puzzle on the topic of Data Analysis. |
Data Analysis |