
These are the resources that support this TEKS Standard.
TEKS.7.12a - Compare two groups of numeric data using comparative dot plots or box plots by comparing their shapes, centers, and spreads.
Displaying 51 - 69 of 69 resources:
| Thumbnail Image | Title | Description | Curriculum Nodes |
|---|---|---|---|
|
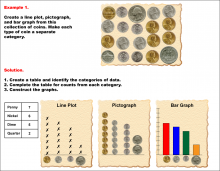
Math Example--Charts, Graphs, and Plots--Graphs of Categorical Data--Example 1 |
Math Example--Charts, Graphs, and Plots-- Graphs of Categorical Data--Example 1
In this set of math examples, analyze the behavior of different scatterplots. This includes linear and quadratic models. |
Data Analysis |
|
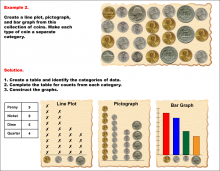
Math Example--Charts, Graphs, and Plots--Graphs of Categorical Data--Example 2 |
Math Example--Charts, Graphs, and Plots-- Graphs of Categorical Data--Example 2
In this set of math examples, analyze the behavior of different scatterplots. This includes linear and quadratic models. |
Data Analysis |
|
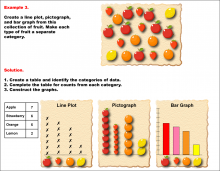
Math Example--Charts, Graphs, and Plots--Graphs of Categorical Data--Example 3 |
Math Example--Charts, Graphs, and Plots-- Graphs of Categorical Data--Example 3
In this set of math examples, analyze the behavior of different scatterplots. This includes linear and quadratic models. |
Data Analysis |
|
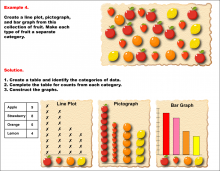
Math Example--Charts, Graphs, and Plots--Graphs of Categorical Data--Example 4 |
Math Example--Charts, Graphs, and Plots-- Graphs of Categorical Data--Example 4
In this set of math examples, analyze the behavior of different scatterplots. This includes linear and quadratic models. |
Data Analysis |
|
Math Example--Charts, Graphs, and Plots--Graphs of Categorical Data--Example 5 |
Math Example--Charts, Graphs, and Plots-- Graphs of Categorical Data--Example 5
In this set of math examples, analyze the behavior of different scatterplots. This includes linear and quadratic models. |
Data Analysis |
|
Math Example--Charts, Graphs, and Plots--Graphs of Categorical Data--Example 6 |
Math Example--Charts, Graphs, and Plots-- Graphs of Categorical Data--Example 6
In this set of math examples, analyze the behavior of different scatterplots. This includes linear and quadratic models. |
Data Analysis |

|
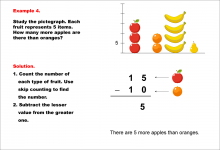
Math Example--Charts, Graphs, and Plots--Reading and Interpreting Scaled Graphs--Example 1 |
Math Example--Charts, Graphs, and Plots-- Reading and Interpreting Scaled Graphs--Example 1
In this set of math examples, analyze the behavior of different scatterplots. |
Subtraction Facts to 100 and Data Analysis |
|
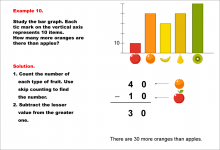
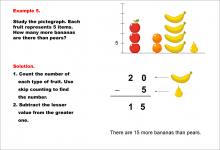
Math Example--Charts, Graphs, and Plots--Reading and Interpreting Scaled Graphs--Example 10 |
Math Example--Charts, Graphs, and Plots-- Reading and Interpreting Scaled Graphs--Example 10
In this set of math examples, analyze the behavior of different scatterplots. |
Subtraction Facts to 100 and Data Analysis |
|
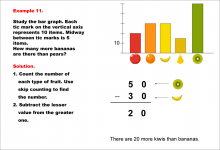
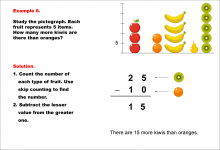
Math Example--Charts, Graphs, and Plots--Reading and Interpreting Scaled Graphs--Example 11 |
Math Example--Charts, Graphs, and Plots-- Reading and Interpreting Scaled Graphs--Example 11
In this set of math examples, analyze the behavior of different scatterplots. |
Subtraction Facts to 100 and Data Analysis |
|
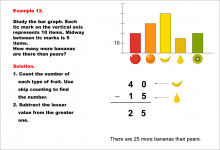
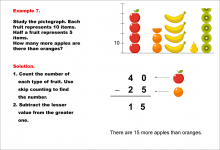
Math Example--Charts, Graphs, and Plots--Reading and Interpreting Scaled Graphs--Example 12 |
Math Example--Charts, Graphs, and Plots-- Reading and Interpreting Scaled Graphs--Example 12
In this set of math examples, analyze the behavior of different scatterplots. |
Subtraction Facts to 100 and Data Analysis |
|
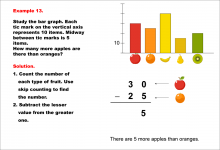
Math Example--Charts, Graphs, and Plots--Reading and Interpreting Scaled Graphs--Example 13 |
Math Example--Charts, Graphs, and Plots-- Reading and Interpreting Scaled Graphs--Example 13
In this set of math examples, analyze the behavior of different scatterplots. |
Subtraction Facts to 100 and Data Analysis |
|
Math Example--Charts, Graphs, and Plots--Reading and Interpreting Scaled Graphs--Example 2 |
Math Example--Charts, Graphs, and Plots-- Reading and Interpreting Scaled Graphs--Example 2
In this set of math examples, analyze the behavior of different scatterplots. |
Subtraction Facts to 100 and Data Analysis |
|
Math Example--Charts, Graphs, and Plots--Reading and Interpreting Scaled Graphs--Example 3 |
Math Example--Charts, Graphs, and Plots-- Reading and Interpreting Scaled Graphs--Example 3
In this set of math examples, analyze the behavior of different scatterplots. |
Subtraction Facts to 100 and Data Analysis |
|
Math Example--Charts, Graphs, and Plots--Reading and Interpreting Scaled Graphs--Example 4 |
Math Example--Charts, Graphs, and Plots-- Reading and Interpreting Scaled Graphs--Example 4
In this set of math examples, analyze the behavior of different scatterplots. |
Subtraction Facts to 100 and Data Analysis |
|
Math Example--Charts, Graphs, and Plots--Reading and Interpreting Scaled Graphs--Example 5 |
Math Example--Charts, Graphs, and Plots-- Reading and Interpreting Scaled Graphs--Example 5
In this set of math examples, analyze the behavior of different scatterplots. |
Subtraction Facts to 100 and Data Analysis |
|
Math Example--Charts, Graphs, and Plots--Reading and Interpreting Scaled Graphs--Example 6 |
Math Example--Charts, Graphs, and Plots-- Reading and Interpreting Scaled Graphs--Example 6
In this set of math examples, analyze the behavior of different scatterplots. |
Subtraction Facts to 100 and Data Analysis |
|
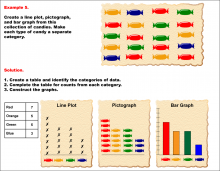
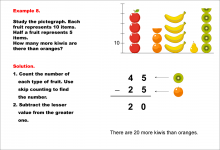
Math Example--Charts, Graphs, and Plots--Reading and Interpreting Scaled Graphs--Example 7 |
Math Example--Charts, Graphs, and Plots-- Reading and Interpreting Scaled Graphs--Example 7
In this set of math examples, analyze the behavior of different scatterplots. |
Subtraction Facts to 100 and Data Analysis |
|
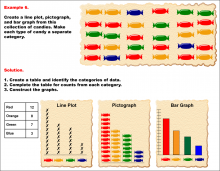
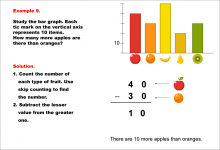
Math Example--Charts, Graphs, and Plots--Reading and Interpreting Scaled Graphs--Example 8 |
Math Example--Charts, Graphs, and Plots-- Reading and Interpreting Scaled Graphs--Example 8
In this set of math examples, analyze the behavior of different scatterplots. |
Subtraction Facts to 100 and Data Analysis |
|
Math Example--Charts, Graphs, and Plots--Reading and Interpreting Scaled Graphs--Example 9 |
Math Example--Charts, Graphs, and Plots-- Reading and Interpreting Scaled Graphs--Example 9
In this set of math examples, analyze the behavior of different scatterplots. |
Subtraction Facts to 100 and Data Analysis |