
These are the resources that support this TEKS Standard.
TEKS.7.6g - Solve problems using data represented in bar graphs, dot plots, and circle graphs, including part-to-whole and part-to-part comparisons and equivalents.
Displaying 201 - 244 of 244 resources:
| Thumbnail Image | Title | Description | Curriculum Nodes |
|---|---|---|---|
|
Math in the News: Issue 8--Tornado Damage |
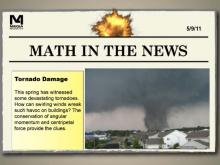
Math in the News: Issue 8--Tornado Damage
5/9/11. In this issue we look at tornado season. In particular we study why the swirling winds of a tornado are so damaging. |
Data Analysis |
|
Math in the News: Issue 80--A Season for the Ages |
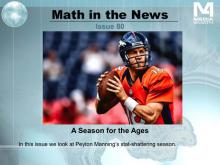
Math in the News: Issue 80--A Season for the Ages
October 2013. In this issue we follow Peyton Manning's extraordinary season with the Denver Broncos. This is a follow-up from Issue 51. |
Data Analysis |
|
Math in the News: Issue 81--The Growth of America |
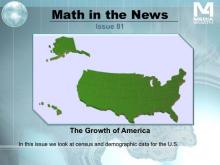
Math in the News: Issue 81--The Growth of America
October 2013. In this issue we look at how America has grown from its formation as a country. |
Data Analysis |
|
Math in the News: Issue 82--Halloween Stats |
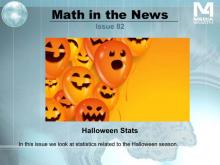
Math in the News: Issue 82--Halloween Stats
October 2013. In this issue we look at statistics related to Halloween 2013. We explore how the economy is affecting holiday spending. |
Data Analysis |
|
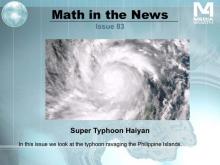
Math in the News: Issue 83--Super Typhoon Haiyan |
Math in the News: Issue 83--Super Typhoon Haiyan
November 2013. In this issue of Math in the News we look at Typhoon Haiyan to learn to distinguish between typhoons and hurricanes. |
Data Analysis |
|
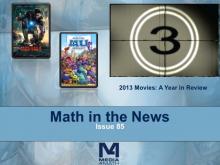
Math in the News: Issue 85--2013 Movies: A Year in Review |
Math in the News: Issue 85--2013 Movies: A Year in Review
January 2014. In this issue of Math in the News we look at box office data from 2013. |
Data Analysis |
|
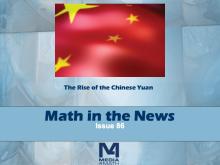
Math in the News: Issue 86--The Rise of the Chinese Yuan |
Math in the News: Issue 86--The Rise of the Chinese Yuan
January 2014. In this issue of Math in the News we look at the foreign exchange market and the rise of the Chinese Yuan. |
Data Analysis |
|
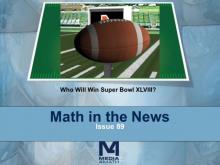
Math in the News: Issue 89--Who Will Win Super Bowl XLVIII? |
Math in the News: Issue 89--Who Will Win Super Bowl XLVIII?
January 2014. In this issue of Math in the News we look at football statistics to examine who stands the best chance of winning Super Bowl XLVIII. |
Data Analysis |
|
Math in the News: Issue 90--America's Candy Crush |
Math in the News: Issue 90--America's Candy Crush
February 2014. In this issue of Math in the News we look at economic data around Valentine's Day purchases. |
Data Analysis |
|
Math in the News: Issue 93--Saving for College |
Math in the News: Issue 93--Saving for College
February 2014. In this issue of Math in the News we look at the investment strategy known as Dollar Cost Averaging. |
Data Analysis |
|
Math in the News: Issue 94--Florida's Orange Crop |
Math in the News: Issue 94--Winter's Impact on Florida's Orange Crop
March 2014. In this issue of Math in the News we look at the impact of a harsh winter on Florida's orange crop. |
Data Analysis |
|
Math in the News: Issue 95--The Iditarod Race |
Math in the News: Issue 95--The Iditarod Race
March 2014. In this issue of Math in the News we look at the Iditarod Race in Alaska. This gives us an opportunity to analyze data on average speed. |
Data Analysis |

|
Video Transcript: Algebra Applications: Data Analysis |
Video Transcript: Algebra Applications: Data Analysis
This is the transcript for the video of same title. |
Data Analysis |
|
|
Video Transcript: Algebra Applications: Data Analysis, Segment 1: Introduction |
Video Transcript: Algebra Applications: Data Analysis, Segment 1: Introduction
This is the transcript for the video of same title. |
Data Analysis |
|
|
Video Transcript: Algebra Applications: Data Analysis, Segment 2: What Is a Mortgage? |
Video Transcript: Algebra Applications: Data Analysis, Segment 2: What Is a Mortgage?
This is the transcript for the video of same title. Video contents: The time value of money is at the basis of all loans. |
Data Analysis |
|
|
Video Transcript: Algebra Applications: Data Analysis, Segment 3: What is a Subprime Mortgage? |
Video Transcript: Algebra Applications: Data Analysis, Segment 3: What is a Subprime Mortgage?
This is the transcript for the video of same title. |
Data Analysis |
|
|
Video Transcript: Algebra Applications: Data Analysis, Segment 4: What is an Adjustable Rate Mortgage? |
Video Transcript: Algebra Applications: Data Analysis, Segment 4: What is an Adjustable Rate Mortgage?
This is the transcript for the video of same title. |
Data Analysis |
|
|
Video Transcript: Algebra Nspirations: Data Analysis and Probability |
Video Transcript: Algebra Nspirations: Data Analysis and Probability
This is the transcript for the video of same title. Video contents: What are the two meanings of statistics? |
Data Analysis |
|
|
Video Transcript: Algebra Nspirations: Data Analysis and Probability, 1 |
Video Transcript: Algebra Nspirations: Data Analysis and Probability, Part 1
This is the transcript for the video of same title. |
Data Analysis |
|
|
Video Transcript: Algebra Nspirations: Data Analysis and Probability, 2 |
Video Transcript: Algebra Nspirations: Data Analysis and Probability, Part 2
This is the transcript for the video of same title. |
Data Analysis |
|
|
Video Transcript: TI-Nspire Mini-Tutorial: Creating a Histogram |
Video Transcript: TI-Nspire Mini-Tutorial: Creating a Histogram
This is the transcript for the TI-Nspire Mini-Tutorial entitled, Creating a Histogram. |
Data Analysis |
|
|
Video Transcript: TI-Nspire Mini-Tutorial: Creating a Random Number Table |
Video Transcript: TI-Nspire Mini-Tutorial: Creating a Random Number Table
This is the transcript for the TI-Nspire Mini-Tutorial entitled, Creating a Random Number Table. |
Probability |
|
VIDEO: Algebra Applications: Data Analysis |
VIDEO: Algebra Applications: Data Analysis
In this episode of Algebra Applications, students explore the dramatic events of 2008 related to the mortgage crisis. |
Data Analysis and Data Gathering |

|
VIDEO: Algebra Applications: Data Analysis, 1 |
VIDEO: Algebra Applications: Data Analysis, Segment 1: Introduction
In this introductory segment students learn about the mortage crisis of 2008. |
Data Analysis and Data Gathering |

|
VIDEO: Algebra Applications: Data Analysis, 2 |
VIDEO: Algebra Applications: Data Analysis, Segment 2: What Is a Mortgage?
The time value of money is at the basis of all loans. |
Data Analysis and Data Gathering |
|
VIDEO: Algebra Applications: Data Analysis, 3 |
VIDEO: Algebra Applications: Data Analysis, Segment 3: What Is a What is a Subprime Mortgage?
Having learned the general features of a mortgage, students learn the specifics of a subprime mortgage. |
Data Analysis and Data Gathering |
|
VIDEO: Algebra Applications: Data Analysis, 4 |
VIDEO: Algebra Applications: Data Analysis, Segment 4: What is an Adjustable Rate Mortgage?
Another factor in the mortgage crisis was the use of adjustable rate mortgages. |
Data Analysis and Data Gathering |
|
VIDEO: Algebra Nspirations: Data Analysis and Probability |
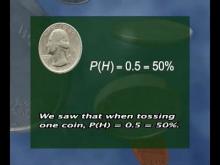
VIDEO: Algebra Nspirations: Data Analysis and Probability
What are the two meanings of statistics? What does it really mean that an event has a 50% probability of occurring? |
Data Analysis and Data Gathering |
|
VIDEO: Algebra Nspirations: Data Analysis and Probability, 1 |
VIDEO: Algebra Nspirations: Data Analysis and Probability, Segment 1
What are the two meanings of statistics? What does it really mean that an event has a 50% probability of occurring? |
Data Analysis and Data Gathering |
|
VIDEO: Algebra Nspirations: Data Analysis and Probability, 2 |
VIDEO: Algebra Nspirations: Data Analysis and Probability, Segment 2
What are the two meanings of statistics? What does it really mean that an event has a 50% probability of occurring? |
Data Analysis and Data Gathering |
|
VIDEO: Algebra Nspirations: Data Analysis and Probability, 3 |
VIDEO: Algebra Nspirations: Data Analysis and Probability, Segment 3
What are the two meanings of statistics? What does it really mean that an event has a 50% probability of occurring? |
Data Analysis and Data Gathering |
|
VIDEO: Algebra Nspirations: Data Analysis and Probability, 4 |
VIDEO: Algebra Nspirations: Data Analysis and Probability, Segment 4
What are the two meanings of statistics? What does it really mean that an event has a 50% probability of occurring? |
Data Analysis and Data Gathering |
|
VIDEO: Ti-Nspire Mini-Tutorial, Video 55 |
VIDEO: TI-Nspire Mini-Tutorial: Creating a Random Number Table
In this TI Nspire tutorial, the Spreadsheet window is used to create a random number table. |
Probability |
|
Worksheet: TI-Nspire Mini-Tutorial: Creating a Histogram |
Worksheet: TI-Nspire Mini-Tutorial: Creating a Histogram
This is part of a collection of math worksheets on the use of the TI-Nspire graphing calculator. |
Data Analysis |
|
|
Worksheet: TI-Nspire Mini-Tutorial: Creating a Random Number Table |
Worksheet: TI-Nspire Mini-Tutorial: Creating a Random Number Table
This is part of a collection of math worksheets on the use of the TI-Nspire graphing calculator. |
Probability |
|
|
Worksheet: TI-Nspire Mini-Tutorial: Graphing a Box-and-Whisker Plot |
Worksheet: TI-Nspire Mini-Tutorial: Graphing a Box-and-Whisker Plot
This is part of a collection of math worksheets on the use of the TI-Nspire graphing calculator. |
Data Analysis |
|
Worksheet: TI-Nspire Mini-Tutorial: Graphing a Multiseries Scatterplot Using a Graphs and Geometry Window |
Worksheet: TI-Nspire Mini-Tutorial: Graphing a Multiseries Scatterplot Using a Graphs and Geometry Window
This is part of a collection of math worksheets on the use of the TI-Nspire graphing calculator. |
Data Analysis |
|
|
Worksheet: TI-Nspire Mini-Tutorial: Graphing a Scatterplot Using a Graphs and Geometry Window |
Worksheet: TI-Nspire Mini-Tutorial: Graphing a Scatterplot Using a Graphs and Geometry Window
This is part of a collection of math worksheets on the use of the TI-Nspire graphing calculator. |
Data Analysis |
|
|
Worksheet: TI-Nspire Mini-Tutorial: Graphing a Scatterplot Using a Statistics Window |
Worksheet: TI-Nspire Mini-Tutorial: Graphing a Scatterplot Using a Statistics Window
This is part of a collection of math worksheets on the use of the TI-Nspire graphing calculator. |
Data Analysis |
|
WORKSHEET: Word Search Puzzle--Data Analysis, Puzzle 1 |
WORKSHEET: Word Search Puzzle--Data Analysis, Puzzle 1
Solve a word search puzzle on the topic of Data Analysis. |
Data Analysis |
|
|
WORKSHEET: Word Search Puzzle--Data Analysis, Puzzle 2 |
WORKSHEET: Word Search Puzzle--Data Analysis, Puzzle 2
Solve a word search puzzle on the topic of Data Analysis. |
Data Analysis |
|
|
WORKSHEET: Word Search Puzzle--Data Analysis, Puzzle 3 |
WORKSHEET: Word Search Puzzle--Data Analysis, Puzzle 3
Solve a word search puzzle on the topic of Data Analysis. |
Data Analysis |
|
|
WORKSHEET: Word Search Puzzle--Data Analysis, Puzzle 4 |
WORKSHEET: Word Search Puzzle--Data Analysis, Puzzle 4
Solve a word search puzzle on the topic of Data Analysis. |
Data Analysis |
|
|
WORKSHEET: Word Search Puzzle--Data Analysis, Puzzle 5 |
WORKSHEET: Word Search Puzzle--Data Analysis, Puzzle 5
Solve a word search puzzle on the topic of Data Analysis. |
Data Analysis |