
These are the resources that support this TEKS Standard.
TEKS.8.11a - Construct a scatterplot and describe the observed data to address questions of association such as linear, non-linear, and no association between bivariate data.
Displaying 51 - 59 of 59 resources:
| Thumbnail Image | Title | Description | Curriculum Nodes |
|---|---|---|---|
|
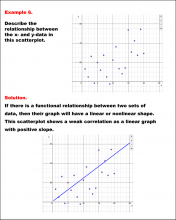
Math Example--Charts, Graphs, and Plots--Analyzing Scatterplots: Example 6 |
Math Example--Charts, Graphs, and Plots-- Analyzing Scatterplots: Example 6
In this set of math examples, analyze the behavior of different scatterplots. This includes linear and quadratic models. |
Data Analysis |
|
Math Example--Charts, Graphs, and Plots--Analyzing Scatterplots: Example 7 |
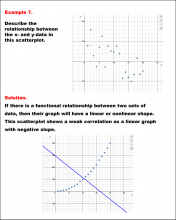
Math Example--Charts, Graphs, and Plots-- Analyzing Scatterplots: Example 7
In this set of math examples, analyze the behavior of different scatterplots. This includes linear and quadratic models. |
Data Analysis |
|
Math Example--Charts, Graphs, and Plots--Analyzing Scatterplots: Example 8 |
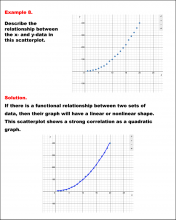
Math Example--Charts, Graphs, and Plots-- Analyzing Scatterplots: Example 8
In this set of math examples, analyze the behavior of different scatterplots. This includes linear and quadratic models. |
Data Analysis |
|
Math Example--Charts, Graphs, and Plots--Analyzing Scatterplots: Example 9 |
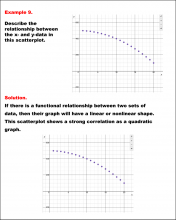
Math Example--Charts, Graphs, and Plots-- Analyzing Scatterplots: Example 9
In this set of math examples, analyze the behavior of different scatterplots. This includes linear and quadratic models. |
Data Analysis |
|
Math Example--Charts, Graphs, and Plots--Estimating the Line of Best Fit: Example 1 |
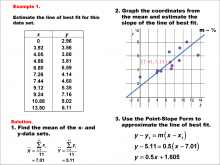
Math Example--Charts, Graphs, and Plots-- Estimating the Line of Best Fit: Example 1
In this set of math examples, analyze the behavior of different scatterplots. |
Slope-Intercept Form and Data Analysis |
|
Math Example--Charts, Graphs, and Plots--Estimating the Line of Best Fit: Example 2 |
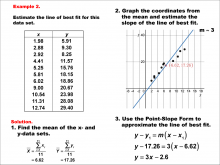
Math Example--Charts, Graphs, and Plots-- Estimating the Line of Best Fit: Example 2
In this set of math examples, analyze the behavior of different scatterplots. |
Point-Slope Form, Slope-Intercept Form and Data Analysis |
|
Math Example--Charts, Graphs, and Plots--Estimating the Line of Best Fit: Example 3 |
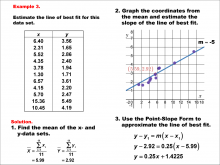
Math Example--Charts, Graphs, and Plots-- Estimating the Line of Best Fit: Example 3
In this set of math examples, analyze the behavior of different scatterplots. |
Point-Slope Form, Slope-Intercept Form and Data Analysis |
|
Math Example--Charts, Graphs, and Plots--Estimating the Line of Best Fit: Example 4 |
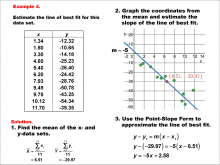
Math Example--Charts, Graphs, and Plots-- Estimating the Line of Best Fit: Example 4
In this set of math examples, analyze the behavior of different scatterplots. |
Point-Slope Form, Slope-Intercept Form and Data Analysis |
|
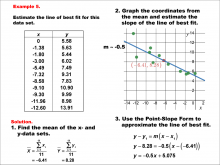
Math Example--Charts, Graphs, and Plots--Estimating the Line of Best Fit: Example 5 |
Math Example--Charts, Graphs, and Plots-- Estimating the Line of Best Fit: Example 5
In this set of math examples, analyze the behavior of different scatterplots. |
Point-Slope Form, Slope-Intercept Form and Data Analysis |