 Lesson Plan: Introduction to Linear Functions
Lesson Summary
This lesson introduces high school students to linear functions, focusing on their definitions, characteristics, and representations. Students will learn to identify linear functions through equations and graphs, understand the concept of slope, and interpret the significance of the y-intercept. The lesson aligns with Common Core Standards F.IF.4 and F.LE.1, providing a foundation for modeling relationships between quantities and distinguishing between linear and exponential functions.
Lesson Objectives
- Define linear functions and their characteristics
- Identify linear functions from equations and graphs
- Understand the concept of slope and its relationship to linear functions
Common Core Standards
- F.IF.4: For a function that models a relationship between two quantities, interpret key features of graphs and tables in terms of the quantities, and sketch graphs showing key features given a verbal description of the relationship.
- F.LE.1: Distinguish between situations that can be modeled with linear functions and with exponential functions.
Prerequisite Skills
- Basic algebraic operations
- Plotting points on the Cartesian coordinate plane
Key Vocabulary
- Function: A relation where each input has exactly one output.
- Multimedia Resource: https://www.media4math.com/library/22045/asset-preview
- Domain: The set of all possible input values (x-values) for a function.
- Multimedia Resource: https://www.media4math.com/library/22030/asset-preview
- Range: The set of all possible output values (y-values) of a function.
- Multimedia Resource: https://www.media4math.com/library/22154/asset-preview
- Linear Function: A function that graphs to a straight line, represented by the equation y=mx+b, where m is the slope and b is the y-intercept.
- Multimedia Resource: https://www.media4math.com/library/22087/asset-preview
- Slope: A measure of the steepness of a line, calculated as the ratio of the change in y to the change in x (rise over run).
- Slope-Intercept Form: The algebraic form of a linear function: y=mx+b, where m is the slope and b is the y-intercept.
- Multimedia Resource: https://www.media4math.com/library/42988/asset-preview
- Y-intercept: The point where the graph of a function crosses the y-axis, indicating the value of y when x is zero.
- Multimedia Resource: https://www.media4math.com/library/42996/asset-preview
- Constant Rate of Change: A consistent change in the value of one variable relative to another; in linear functions, the slope represents this constant rate.
- Multimedia Resource: https://www.media4math.com/library/42989/asset-preview
Multimedia Resources
- Math definitions of terms related to linear equations and functions: https://www.media4math.com/Definitions--LinearFunctions
- Video definitions on the topic of linear equations and functions: https://www.media4math.com/MathVideoCollection--LinearFunctionsDefinitions
- Math definitions of terms related to functions and relations: https://www.media4math.com/Definitions--FunctionsRelations
Warm Up Activities
Choose from one or more of these activities.
Activity 1: Graphing Coordinates in Desmos
Before diving into linear functions, students will practice plotting points on the coordinate plane using the Desmos Graphing Calculator. This activity reinforces coordinate graphing skills and prepares students for understanding how points relate to linear functions.
Instructions:
- Open the Desmos Graphing Calculator.
- Click on the "+" button and select "Table" to enter coordinates.
- Input the following ordered pairs into the table:
- (-3, -2)
- (-1, 0)
- (2, 3)
- (4, 5)
- Observe how the points align on the graph.
- Connect the points by entering an equation that fits them. Hint: Identify the slope and y-intercept!

After plotting, discuss how the points relate to a linear equation and how different slopes and y-intercepts affect the graph.
Activity 2: Using Star Trek to Explain Functions
Use this video to go over the properties of functions and relations. If students are not familiar with these topics, you can use this video in the Teach section:
Activity 3: Real-World Examples of Linear Functions
Introduce the concept of linear functions by showing real-life examples. Use this slide show:
https://www.media4math.com/library/slideshow/applications-linear-equations
Or, use one of these these slide shows, which show a more detailed explanation of these real-world applications of linear functions. Use these initially to show that there are many real-world examples of linear functions. At the end of the lesson return to these applications as a review.

- Cricket chirps vs. Temperature: https://www.media4math.com/library/slideshow/application-linear-functions-cricket-chirps
- Cost vs. time for renting equipment: https://www.media4math.com/library/slideshow/application-linear-functions-cost-vs-time
- Distance vs. time: https://www.media4math.com/library/slideshow/application-linear-functions-distance-vs-time
Teach
What is a Function?
A function is a relationship between inputs and outputs where each input (x-value) corresponds to exactly one output (y-value). Functions can be represented as equations, tables, graphs, or mappings.
Example: Consider the equation y=2x+3. For every x-value, there is only one corresponding y-value:
- If x=1, then y=2(1)+3=5.
- If x=2, then y=2(2)+3=7.
This one-to-one relationship between x and y confirms that the equation represents a function.

What is the Domain?
The domain of a function is the set of all possible x-values (inputs) that can be used in the function. The domain may be limited based on real-world constraints.
Example: In a function that represents the number of tickets sold for a concert, x-values must be non-negative whole numbers. These would be the domain of this function.
What is the Range?
The range of a function is the set of all possible y-values (outputs) the function produces. The range depends on the domain and the behavior of the function.
Example: In the function y=2x+3, if the domain is {1, 2, 3}, then the range is {5, 7, 9}.

What is the General Form of a Linear Function?
A linear function is any function that forms a straight line when graphed. The general form of a linear function is:
y=mx+b
- m is the slope, which measures the steepness of the line (rise over run).
- b is the y-intercept, where the graph crosses the y-axis.
Example: The function y=3x−2 has a slope of 3 and a y-intercept of -2. This means for every 1-unit increase in x, y increases by 3.
By understanding these fundamental concepts, students build a strong foundation for working with linear functions in equations, tables, and graphs.
Definitions
Define linear functions as relationships where the rate of change between variables is constant. Review these definitions:
- Linear Function: https://www.media4math.com/library/22087/asset-preview
- Slope-intercept Form: https://www.media4math.com/library/42988/asset-preview
- Rate of Change: https://www.media4math.com/library/42989/asset-preview
- y-intercept: https://www.media4math.com/library/42996/asset-preview
If necessary, review the definition of slope with this video definition:
Examples
Use this slide show to review the properties of linear functions before showing examples of graphs of linear functions:
https://www.media4math.com/library/slideshow/graphs-linear-functions
Use this slide show to demonstrate examples of graphs of linear functions given the slope and y-intercept:
https://www.media4math.com/library/slideshow/math-examples-slope-intercept-form
Use this Desmos activity to explore graphs of linear functions in slope-intercept form:
https://www.media4math.com/library/40088/asset-preview
Here is a worksheet to accompany this activity:
https://www.media4math.com/library/40089/asset-preview
Example 1: Positive Slope, Positive Y-Intercept (Earnings from a Job)
Problem: Sarah works as a tutor and earns \$20 per hour. If she already has \$50 saved, how much money will she have after x hours?
- Write the function: y=20x+50, where:
- x = hours worked (input)
- y = total money saved (output)
- Slope m=20 (earns \$20 per hour)
- Y-intercept b=50 (starting savings)
- Find y when x=5: y=20(5)+50y=100+50y=150
- Domain: x≥0 (she cannot work negative hours).
- Range: y≥50 (her savings cannot be less than the starting amount).

Example 2: Negative Slope, Negative Y-Intercept (Car Depreciation)
Problem: A car's value decreases by \$1,500 per year. If its initial value is \$30,000, write a function to model its depreciation over time.
- Write the function: y=−1500x+30000, where:
- x = years owned
- y = car’s value
- Slope m=−1500 (losing \$1,500 per year)
- Y-intercept b=30,000 (initial value)
- Find y after 10 years:y=−1500(10)+30000y=−15000+30000y=15000
- Domain: 0≤x≤20 (realistically, a car won’t depreciate forever).
- Range: 0≤y≤30000 (car value never goes negative).

Example 3: Zero Slope, Negative Y-Intercept (Water Reservoir Level)
Problem: A town’s water reservoir has a constant water level of 500,000 gallons due to steady rainfall and consumption. Model the water level over time.

- Write the function: y=500,000, where:
- x = time (days, weeks, etc.)
- y = water level
- Slope m=0 (no change in water level over time)
- Find y after 30 days:y=500,000
- Domain: x≥0 (time cannot be negative).
- Range: y=500,000 (water level remains constant).
Example 4: Positive Slope, Positive Y-Intercept (Total Internet Subscription Cost)
Problem: A company charges \$50 per month for an internet subscription. Model the total cost after x months.
- Write the function: y=50x, where:
- x = number of months
- y = total cost in dollars
- Slope m=50 (cost increases by \$50 per month)
- Y-intercept b=0 (initial cost is zero before subscription starts)
- Find y after 6 months:y=50(6)y=300
- Domain: x≥0 (number of months cannot be negative).
- Range: y≥0 (total cost starts at zero and increases over time).
Example 5: Positive Slope, Zero Y-Intercept (Hourly Wage Without Initial Pay)
Problem: A part-time employee earns \$15 per hour, with no starting salary. Model their earnings over time.
- Write the function: y=15x, where:
- x = hours worked
- y = total earnings
- Slope m=15 (earns \$15 per hour)
- Y-intercept b=0 (no base salary)
- Find y after 8 hours:y=15(8)y=120
- Domain: x≥0 (cannot work negative hours).
- Range: y≥0 (earnings start at zero).
Example 6: Negative Slope, Zero Y-Intercept (Battery Drain)
Problem: A smartphone battery starts at 100% and drains by 5% per hour. Model battery life over time.
- Write the function: y=−5x+100, where:
- x = hours
- y = battery percentage
- Slope m=−5 (loses 5% per hour)
- Y-intercept b=100 (fully charged at x=0)
- Find y after 10 hours:y=−5(10)+100y=−50+100
- Domain: 0≤x≤20 (battery dies after 20 hours).
- Range: 0≤y≤100 (battery cannot exceed 100% or go below 0%).

Review
Summary of the Lesson
In this lesson, students learned the fundamentals of linear functions, including how to define, interpret, and apply them in real-world contexts. A function is a relationship where each input corresponds to exactly one output. The key components of a linear function include slope, y-intercept, domain, and range. Students explored different types of linear functions, including those with positive and negative slopes, zero slopes, and various y-intercepts. They also practiced solving and graphing linear functions and analyzing domain and range based on real-world constraints.
Key Vocabulary
- Function: A relationship where each input (x) corresponds to exactly one output (y).
- Domain: The set of all possible input values (x-values) for a function.
- Range: The set of all possible output values (y-values) of a function.
- Linear Function: A function that graphs as a straight line and follows the equation y=mx+b.
- Slope: The rate of change of a function, calculated as rise over run.
- Y-Intercept: The point where the function crosses the y-axis.
- Constant Rate of Change: A consistent change in the value of y for every unit change in x.
Games
- Drag-and-drop activity to review linear functions in slope-intercept form. Match the equation to the description: https://www.media4math.com/library/4829/asset-preview
- Algebra Jeopardy game: https://www.media4math.com/library/4813/asset-preview
- Word Search puzzle: https://www.media4math.com/library/35546/asset-preview
Additional Examples
Example 1: Positive Slope, Positive Y-Intercept (Saving Money)
Problem: Lisa is saving money for a new laptop. She starts with \$100 and saves \$25 per week. Model her savings as a function of time.
- Write the function: y=25x+100, where:
- x = weeks of saving
- y = total savings
- Slope m=25 (saves \$25 per week)
- Y-intercept b=100 (starting balance)
- Find y after 4 weeks:
- Domain: x≥0 (time cannot be negative).
- Range: y≥100 (savings starts at \$100 and increases).
Example 2: Negative Slope, Negative Y-Intercept (Owing Money)
Problem: A small business takes out a loan of \$5,000 and repays \$200 per month. Model the remaining balance as a function of time.
- Write the function: y=−200x+5000, where:
- x = months
- y = remaining loan balance
- Slope m=−200 (reducing debt by \$200 per month)
- Y-intercept b=5000 (starting loan balance)
- Find y after 10 months:
- Domain: 0≤x≤25 (loan will be paid off in 25 months).
- Range: 0≤y≤5000 (loan balance decreases but never goes negative).
Example 3: Zero Slope, Positive Y-Intercept (Flat Monthly Subscription)
Problem: A gym offers a monthly membership for \$40, with no additional fees. Model the total cost as a function of time.
- Write the function: y=40x, where:
- x = months of membership
- y = total cost
- Slope m=40 (cost increases by \$40 per month)
- Y-intercept b=0 (no starting cost before joining)
- Find y after 3 months:
- Domain: x≥0 (cannot have negative months).
- Range: y≥0 (total cost starts at zero and increases).
Quiz
Answer the following questions.
- Which equation represents a linear function?
a) y = 2x + 3
b) y = x²
c) y = 3ˣ
d) y = 1/x - What is the slope of the line y = -4x + 7?
- Identify the y-intercept of the function f(x) = 3x - 5.
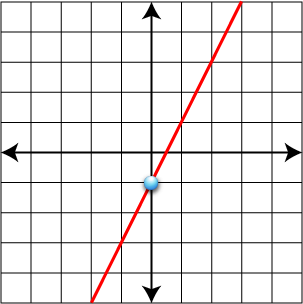
Graph the linear function y = 2x - 1.
- Is the function y = √x linear? Explain why or why not.
- Find the slope of the line passing through points (2, 5) and (4, 9).
- Write the equation of a line with slope 3 and y-intercept -2.
- Determine if the following table represents a linear function:
x | 1 | 2 | 3 | 4
y | 3 | 5 | 7 | 9 - What is the slope of a horizontal line?
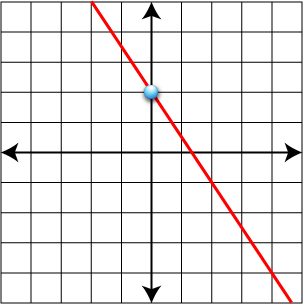
Sketch a graph of a linear function with a negative slope and positive y-intercept.
Answer Key
- a
- -4
- -5
- No, because it is not in slope-intercept or standard form.
- 2
- y = 3x - 2
- Yes, the rate of change is constant (2)
- 0
Check that student graph shows a downward sloping line crossing the positive y-axis. Here is an example:
![]() Purchase the lesson plan bundle. Click here.
Purchase the lesson plan bundle. Click here.