 Lesson Plan: Understanding Direct Variation and Its Connection to Proportional Relationships
Lesson Objectives
This lesson can be completed in one 50-minute class period.
- Understand the concept of direct variation
- Identify direct variations in real-world situations
- Represent direct variations using equations, tables, and graphs
- Analyze and interpret direct variation relationships
Florida BEST Standards
- MA.8.AR.3.1: Determine if a linear relationship is also a proportional relationship.
- MA.8.AR.3.2: Given a table, graph or written description of a linear relationship, determine the slope.
- MA.8.AR.3.3: Given a real-world situation, determine if the relationship between two quantities is linear. Write an equation in slope-intercept form.
- MA.8.F.1.1: Given a set of ordered pairs, a table, a graph or mapping diagram, determine whether the relationship is a function. Identify the domain and range of the relation.
- MA.8.AR.1.3: Rewrite algebraic expressions with rational coefficients in different but equivalent forms.
Prerequisite Skills
- Graphing on a coordinate plane
- Understanding of proportional relationships
- Basic knowledge of linear equations
Key Vocabulary
- Direct variation
- Constant of variation
- Proportional relationship
- Linear function
- Slope-intercept form
Warm-up Activity (10 minutes)
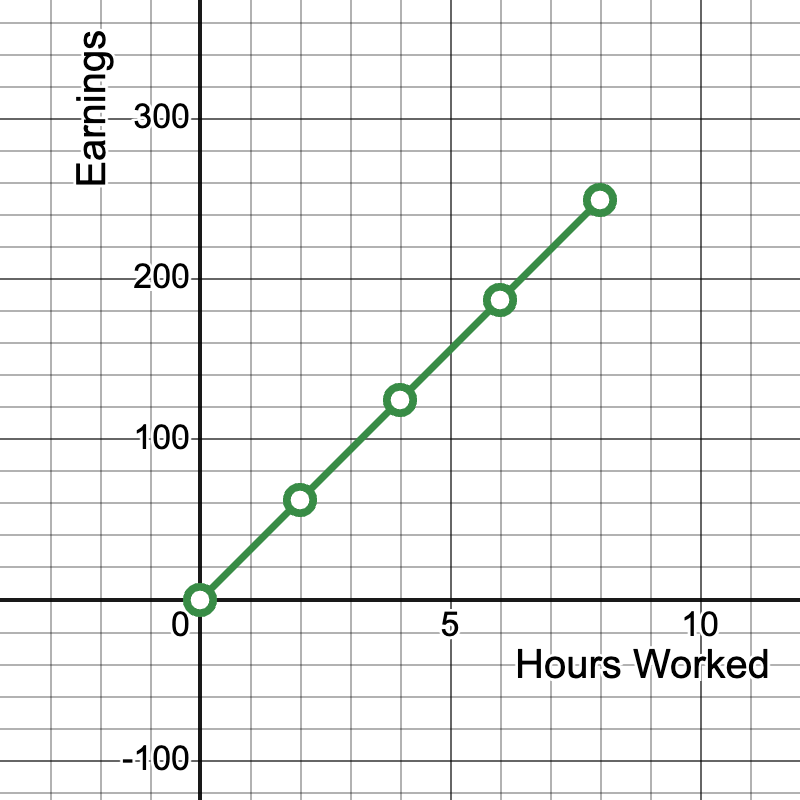
Students are presented with the following real-world data set showing the relationship between hours worked and total earnings based on the average hourly wage in the United States (data from Bureau of Labor Statistics, 2021):
| Hours Worked | Total Earnings ($) |
|---|---|
| 0 | 0 |
| 2 | 62.34 |
| 4 | 124.68 |
| 6 | 187.02 |
| 8 | 249.36 |
Students are asked to:
- Plot these points on a coordinate plane
- Determine if they form a straight line through the origin
- Calculate the average hourly wage (slope of the line)
- Write the direct variation equation for this relationship
Here is the graph of the data, with a line connecting the data points:
Here is a Desmos activity you can use:
https://www.desmos.com/calculator/hsxpiioouh
Teach (25 minutes)
Definitions
- Direct variation: A relationship between two variables where one is a constant multiple of the other, expressed as y = kx.
- Constant of variation: The constant k in the direct variation equation y = kx, representing the ratio of y to x.
- Proportional relationship: A relationship where the ratio of two quantities remains constant as the quantities change.
- Linear function: A function whose graph is a straight line, often written in the form y = mx + b.
- Slope-intercept form: The equation of a line written as y = mx + b, where m is the slope and b is the y-intercept.
Use this slide show to review these and other definitions:
https://www.media4math.com/library/slideshow/direct-variation-definitions
Instruction
Introduce direct variations with this video:
https://www.media4math.com/library/44915/asset-preview
Explain the concept of direct variation (y = kx, where k is the constant of variation), demonstrate how direct variation is a special case of linear relationships where the y-intercept is zero, show how to graph direct variation equations, and explain how the constant of variation relates to the slope and unit rate in proportional relationships.
Example 1: Circumference and Diameter of a Circle
Use this slide show with this example:
https://www.media4math.com/library/slideshow/applications-direct-variations-circles
The circumference (C) of a circle varies directly with its diameter (D).
- Write the direct variation equation.
- Calculate the circumference of a circle with a diameter of 10 cm.
- Interpret the constant of variation.
Solution:
- Equation: C = πD, where C is the circumference and D is the diameter
- Circumference: C = π(10) ≈ 31.42 cm
- The constant of variation (π) represents the ratio of circumference to diameter for all circles
This Desmos activity can be used to support this activity:
https://www.desmos.com/calculator/sthkxtueqj
Example 2: Hooke's Law
Use this slide show to accompany this example:
https://www.media4math.com/library/slideshow/application-linear-functions-hookes-law
Hooke's Law states that the force (F) needed to extend or compress a spring by some distance (x) varies directly with that distance.
- Write the direct variation equation for Hooke's Law.
- If a force of 50 N extends a spring by 0.25 m, what is the spring constant?
- Calculate the force needed to extend the same spring by 0.4 m.
Solution:
- Equation: F = kx, where F is the force, x is the displacement, and k is the spring constant
- Spring constant: k = F/x = 50/0.25 = 200 N/m
- Force for 0.4 m extension: F = 200(0.4) = 80 N
Example 3: Currency Exchange
Use this slide show to accompany this example:
https://www.media4math.com/library/slideshow/applications-proportions-exchange-rates
The exchange rate between US dollars and euros is 1 USD = 0.85 EUR.
- Write the direct variation equation.
- Calculate how many euros 120 USD would exchange for.
- Interpret the constant of variation.
Solution:
- Equation: e = 0.85d, where e is euros and d is US dollars
- Euros: e = 0.85(120) = 102 EUR
- The constant of variation (0.85) represents the exchange rate
Example 4: AI-Enabled Smartphone Revenue
A tech company has collected data on the number of AI-enabled smartphones sold and the corresponding revenue:
| Units Sold (x) | Revenue in $1000s (y) |
|---|---|
| 0 | 0 |
| 100 | 750 |
| 200 | 1500 |
| 300 | 2250 |
| 400 | 3000 |
- Plot these points on a coordinate plane.
- Determine if they form a straight line through the origin.
- Calculate the revenue per unit sold (slope of the line).
- Write the direct variation equation for this relationship.
- Use the equation to predict the revenue for 500 units sold.
Solution:
The points form a straight line through the origin when plotted.
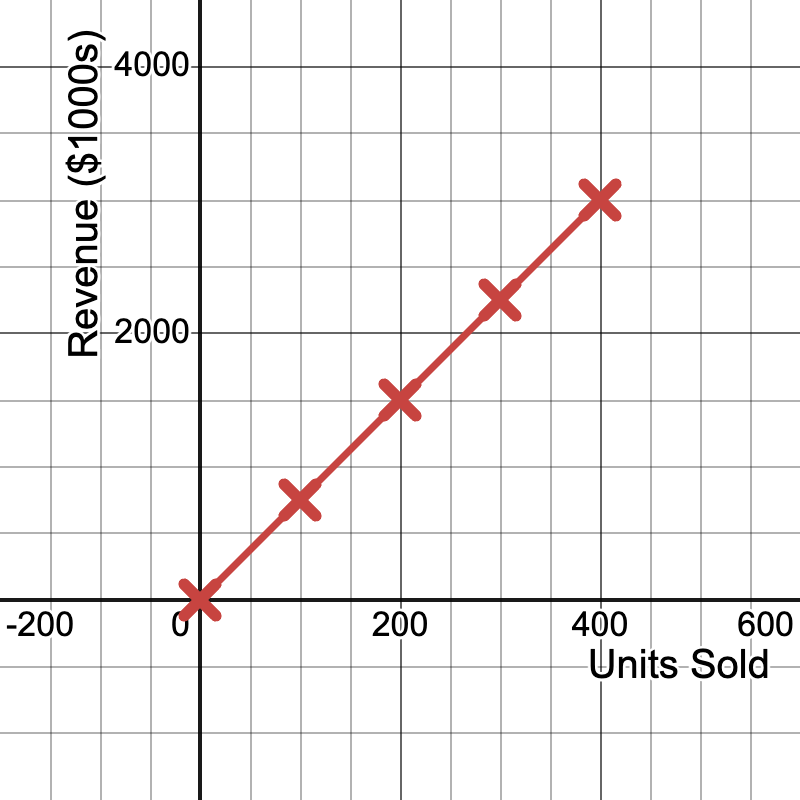
- Slope (revenue per unit) = 3000/400 = 7.5
- Direct variation equation: y = 7.5x, where y is revenue in $1000s and x is units sold
- For 500 units: y = 7.5(500) = 3750
- The company can expect $3,750,000 in revenue from selling 500 units.
Here is a Desmos activity you can use:
https://www.desmos.com/calculator/gsao4ev7lw
Review (10 minutes)
Partner activity: Students analyze and create real-world scenarios for given direct variation equations from art, technology, and nature.
Example 1 (Art): Mural Paint Calculation

A mural artist has found that the amount of paint used is directly proportional to the wall area. For every 3 square feet of wall, 1 ounce of paint is used.
- Write the direct variation equation.
- Calculate the amount of paint needed for a 150 square foot mural.
- If the artist has 60 ounces of paint, what size mural can they complete?
Solution:
- Equation: P = (1/3)A, where P is the amount of paint in ounces and A is the wall area in square feet
- Paint needed for 150 sq ft: P = (1/3)(150) = 50 ounces
- Mural size with 60 ounces: A = 3P = 3(60) = 180 square feet
Example 2 (Technology): Data Transfer Rate
In a fiber optic network, the amount of data transferred is directly proportional to the time of transfer. The transfer rate is 100 megabits per second.
- Write the direct variation equation.
- How much data can be transferred in 5 minutes?
Solution:
- Equation: D = 100t, where D is the amount of data in megabits and t is the time in seconds
- Data transferred in 5 minutes: D = 100(5 * 60) = 30,000 megabits = 30 gigabits
Example 3 (Nature): Photosynthesis and Light Intensity
The rate of photosynthesis in a plant is directly proportional to light intensity (within a certain range). If the rate of photosynthesis is 2 μmol CO₂/m²/s at a light intensity of 100 μmol photons/m²/s:
- Write the direct variation equation.
- Predict the photosynthesis rate at a light intensity of 250 μmol photons/m²/s.
Solution:
- Equation: R = 0.02I, where R is the rate of photosynthesis in μmol CO₂/m²/s and I is the light intensity in μmol photons/m²/s
- Photosynthesis rate at 250 μmol photons/m²/s: R = 0.02(250) = 5 μmol CO₂/m²/s
Assess (5 minutes)
Administer this 10-question quiz.
Quiz
- Write the direct variation equation for y varying directly as x with a constant of variation of 3.
- What is the constant of variation in the equation y = 2.5x?
- Graph the direct variation equation y = 0.5x.

- If y varies directly as x, and y = 12 when x = 4, what is the constant of variation?
- In a direct variation, if x increases by 2, y increases by 6. What is the constant of variation?
- Write an equation for a direct variation that passes through the point (2, 10).
- How does the graph of y = 3x compare to y = 2x?
- In the equation y = 40x, where y is total cost and x is the number of items, what does 40 represent?
- If distance varies directly as time, and a car travels 240 miles in 4 hours, write the direct variation equation.
- Explain why all direct variation equations represent proportional relationships.
Answer Key
- y = 3x
- 2.5
- 3
- 3
- y = 5x
- y = 3x has a steeper slope
- The cost per item
- d = 60t, where d is distance in miles and t is time in hours
- In direct variations, y = kx, which always passes through (0,0) and has a constant ratio y/x = k, meeting the definition of a proportional relationship.
![]() Purchase the lesson plan bundle. Click here.
Purchase the lesson plan bundle. Click here.