 Lesson Plan: Graphing Linear Functions
Lesson Objectives
- Graph linear functions using different methods
- Understand slope-intercept form
- Interpret slope and y-intercept in real-world contexts
Florida BEST Standards
- MA.912.F.1.1: Classify functions as linear, quadratic, cubic, exponential, logarithmic, rational, or absolute value.
- MA.912.F.1.2: Determine key features of function graphs including extrema, end behavior, intercepts, domain, and range.
- MA.912.AR.2.3: Write linear two-variable equations from various representations.
- MA.912.AR.2.4: Graph linear functions and determine key features.
- MA.912.AR.2.5: Solve and graph problems modeled with linear functions.
- MA.912.F.2.1: Identify effects of transformations on function graphs.
Prerequisite Skills
- Understanding linear functions and equations
- Plotting points on the Cartesian coordinate plane
Key Vocabulary
- x-intercept
- y-intercept
- slope-intercept form
- point-slope form
- increasing function
- decreasing function
- standard form
Warm-up Activity (5 minutes)
Display three linear equations in slope-intercept form:
y = 2x + 4
y = 3x - 7
y = -4x - 9
Ask students to identify the slope and y-intercept for each equation. Have them complete a table like this:
| Equation | Slope | y-intercept |
| y = 2x + 4 | 2 | 4 |
| y = 3x - 7 | 3 | -7 |
| y = -4x - 9 | -4 | -9 |
Teach (20 minutes)
Definitions
Review the following video definitions:
- Slope-intercept form: https://www.media4math.com/library/74604/asset-preview
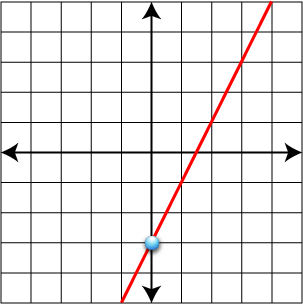
- Increasing function: https://www.media4math.com/library/74601/asset-preview
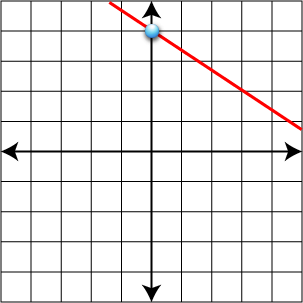
- Decreasing function: https://www.media4math.com/library/74602/asset-preview
- x-intercept: https://www.media4math.com/library/74609/asset-preview
- y-intercept: https://www.media4math.com/library/74608/asset-preview
- Point-slope form: https://www.media4math.com/library/74606/asset-preview
- Standard form:
Show these videos to explain increasing and decreasing functions. The videos describe these properties in the context of any function, but anchor the discussion to linear functions.
- Increasing functions: https://www.media4math.com/library/44909/asset-preview
- Decreasing functions: https://www.media4math.com/library/44910/asset-preview
Use multiple representations to teach graphing linear functions:
1. Algebraic Representation
Show these equivalent linear equations but written in these forms:
- Slope-intercept form: y = -x +1
- Standard form: x + y = 1
- Point-slope form: y-1 = (-x - 0)
Use this Desmos activity to explore these equivalent forms and explore others:
https://www.desmos.com/calculator/w5spiazzqr
Review this real-world application to generate an equation in standard form:
https://www.media4math.com/library/21416/asset-preview
Review how to convert from standard form to slope-intercept form:
https://www.media4math.com/library/42998/asset-preview
Finally review a step-by-step procedure for the point-slope form:
https://www.media4math.com/library/74306/asset-preview
2. Graphical Representation
Use this slide show to demonstrate graphing linear functions in slope-intercept form:
https://www.media4math.com/library/slideshow/math-examples-slope-intercept-form
3. Tabular Representation
Use this slide show to demonstrate multiple representations of linear functions that includes algebraic, graphical, and tabular:
https://www.media4math.com/library/slideshow/multiple-representations-linear-equations
4. Verbal Representation
Start with a verbal representation that should be familiar to students:
"There is a linear relationship between the circumference of a circle and its radius. What is the linear function?"
Write the equation: C = k•d.
Ask students what k represents. For those who need help have them find the formula for the circumference of a circle.
Select one of these real-world applications of linear functions and show how to derive the appropriate equation:
- Cricket chirps vs. Temperature: https://www.media4math.com/library/slideshow/application-linear-functions-cricket-chirps
- Cost vs. time for renting equipment: https://www.media4math.com/library/slideshow/application-linear-functions-cost-vs-time
- Distance vs. time: https://www.media4math.com/library/slideshow/application-linear-functions-distance-vs-time
5. Contextual Representation
Introduce this video, which is an application of linear functions in the context of excercise:
https://www.media4math.com/library/21299/asset-preview
Review (15 minutes)
Have students review the different linear forms using these drag-and-drop activities:
- Slope-intercept: https://www.media4math.com/library/4829/asset-preview
- Standard form: https://www.media4math.com/library/4830/asset-preview
- Point-slope form: https://www.media4math.com/library/4841/asset-preview
Assess (10 minutes)
Administer a 10-question quiz to assess understanding.
Quiz
- Graph y = 2x - 3
- Find the x- and y-intercepts of 3x - 2y = 6
- Write the equation of the line passing through (2, 5) with a slope of -1/2
- Graph 2x + 3y = 12
- Identify the slope and y-intercept of y = -4x + 7
- Find the slope of the line passing through (-1, 3) and (4, -2)
- Graph y - 1 = 2(x - 2)
- Write the equation of the line with y-intercept 5 and x-intercept -3
- Determine if y = -2x + 1 represents an increasing or decreasing function
- A company charges a $15 setup fee plus $8 per hour for their service. Write an equation representing the cost (y) in terms of hours (x).
Answer Key

- x-intercept: (2, 0), y-intercept: (0, -3)
- y - 5 = -1/2(x - 2) or y = -1/2x + 6
- Slope: -4, y-intercept: 7
- Slope = -1
- y = -5/3x + 5
- Decreasing function
- y = 8x + 15
![]() Purchase the lesson plan bundle. Click here.
Purchase the lesson plan bundle. Click here.