
Illustrative Math Alignment: Grade 6 Unit 3
Unit Rates and Percentages
Lesson 7: Equivalent Ratios Have the Same Unit Rates
Use the following Media4Math resources with this Illustrative Math lesson.
| Thumbnail Image | Title | Body | Curriculum Nodes |
|---|---|---|---|

|
Lesson Plan--Ratios, Proportions, and Percents (Gr 6)--Lesson 5--Applying Ratios and Proportional Reasoning | Lesson Plan: Applying Ratios and Proportional Reasoning This lesson plan is designed to provide sixth-grade students with a comprehensive understanding of ratios, proportions, and percents. Through engaging activities, hands-on explorations, and real-world applications, learners develop essential skills in comparing quantities, scaling figures up or down, and converting between fractions, decimals, and percents. This lesson emphasizes critical thinking and problem-solving strategies that help students apply mathematical reasoning to everyday situations, such as adjusting recipes, budgeting, and analyzing data. Key topics covered in this lesson include: |
Applications of Ratios, Proportions, and Percents |

|
Lesson Plan--Ratios, Proportions, and Percents (Gr 7)--Lesson 1--Introduction to Ratios and Unit Rates | Lesson Plan: Introduction to Ratios and Unit Rates This lesson introduces seventh-grade students to ratios and unit rates, emphasizing their real-world applications. Through engaging activities and problem-solving exercises, students will develop proportional reasoning skills. |
Ratios and Rates |

|
Lesson Plan--Ratios, Proportions, and Percents (Gr 7)--Lesson 2--Unit Rates and Complex Fractions | Lesson Plan: Unit Rates and Complex Fractions This lesson introduces seventh-grade students to unit rates and complex fractions, helping them develop a deeper understanding of proportional relationships and fraction operations. Students will learn to compute unit rates with fractional quantities, simplify complex fractions, and apply these skills to real-world situations such as speed calculations, recipe adjustments, and measurement conversions. |
Ratios and Rates and Applications of Ratios, Proportions, and Percents |

|
Lesson Plan--Ratios, Proportions, and Percents (Gr 7)--Lesson 5--Solving Multi-Step Ratio and Percent Problems | Lesson Plan: Solving Multi-Step Ratio Problems In this lesson, students will develop their problem-solving skills by tackling multi-step ratio and proportion problems. They will learn how to analyze complex ratio scenarios, apply proportional reasoning, and use unit conversions to solve real-world problems. This lesson builds on students' understanding of ratios and proportions, reinforcing their ability to work through multi-step calculations with confidence. Key concepts covered in this lesson include: |
Applications of Ratios, Proportions, and Percents |
|
Math Clip Art--Applications of Equivalent Ratios--Vehicle Ratios 1 | Math Clip Art--Applications of Equivalent Ratios--Vehicle Ratios 1TopicRatios DescriptionThis math clip art image is a title card for a series of math clip art images that apply equivalent ratios problems. The subsequent images show different vehicle ratios. This image, along with the overall collection, can be used to teach ratios by comparing the number of cars to other vehicle types or parking spaces. Teachers can use this visual to introduce the concept of part-to-whole ratios, such as the ratio of cars to total vehicles, or part-to-part ratios, like comparing the number of cars to motorcycles or SUVs in subsequent images. |
Ratios and Rates |
|
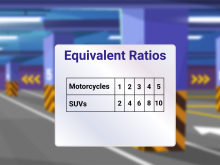
Math Clip Art--Applications of Equivalent Ratios--Vehicle Ratios 10 | Math Clip Art--Applications of Equivalent Ratios--Vehicle Ratios 10TopicRatios DescriptionThis math clip art image displays a table with two rows labeled "Motorcycles" and "SUVs". The numbers in the table are 1, 2, 3, 4, 5 for Motorcycles and 2, 4, 6, 8, 10 for SUVs. This visual representation is crucial for teaching the concept of equivalent ratios using a different set of vehicles. |
Ratios and Rates |
|
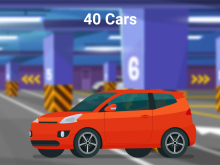
Math Clip Art--Applications of Equivalent Ratios--Vehicle Ratios 2 | Math Clip Art--Applications of Equivalent Ratios--Vehicle Ratios 2TopicRatios DescriptionThis math clip art image showcases a red car in a parking garage with numbered pillars in the background. The caption "40 Cars" provides context for the ratio concept being illustrated. This image is part of a series designed to teach equivalent ratios using vehicles as a relatable subject matter. |
Ratios and Rates |
|
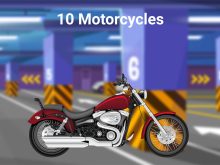
Math Clip Art--Applications of Equivalent Ratios--Vehicle Ratios 3 | Math Clip Art--Applications of Equivalent Ratios--Vehicle Ratios 3TopicRatios DescriptionThis math clip art image depicts a red motorcycle in a parking garage with numbered pillars in the background. The caption "10 Motorcycles" provides essential information for understanding ratios in the context of vehicles. This image is part of a series designed to teach equivalent ratios using different types of vehicles. |
Ratios and Rates |
|
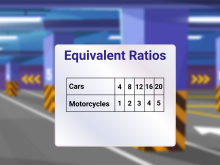
Math Clip Art--Applications of Equivalent Ratios--Vehicle Ratios 6 | Math Clip Art--Applications of Equivalent Ratios--Vehicle Ratios 6TopicRatios DescriptionThis math clip art image presents a table showing equivalent ratios of cars to motorcycles. The table displays five pairs of values: 4:1, 8:2, 12:3, 16:4, and 20:5. This visual representation is instrumental in teaching the concept of equivalent ratios and how they scale up while maintaining the same proportional relationship. |
Ratios and Rates |
|
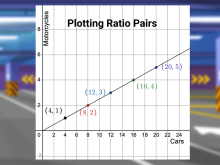
Math Clip Art--Applications of Equivalent Ratios--Vehicle Ratios 8 | Math Clip Art--Applications of Equivalent Ratios--Vehicle Ratios 8TopicRatios DescriptionThis math clip art image presents another graph plotting the same ratio pairs as before, but with a line connecting them to show the linear relationship. This visual representation is crucial for teaching the concept of equivalent ratios and their graphical interpretation in a more comprehensive manner. |
Ratios and Rates |
|
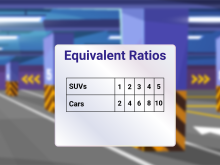
Math Clip Art--Applications of Equivalent Ratios--Vehicle Ratios 9 | Math Clip Art--Applications of Equivalent Ratios--Vehicle Ratios 9TopicRatios DescriptionThis math clip art image presents a table with two rows labeled "SUVs" and "Cars". The numbers in the table are 1, 2, 3, 4, 5 for SUVs and 2, 4, 6, 8, 10 for Cars. This visual representation is essential for teaching the concept of equivalent ratios in a tabular format. |
Ratios and Rates |
|
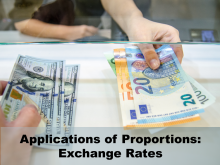
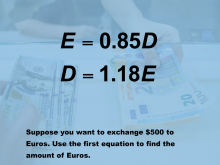
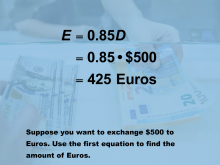
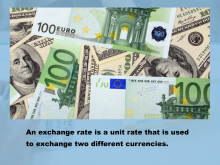
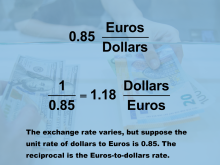
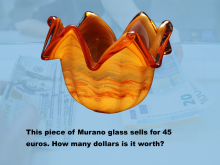
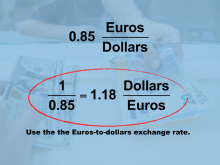
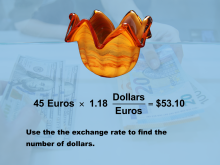
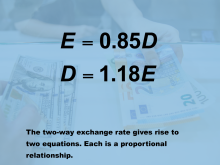
Math Clip Art--Applications of Proportions--Exchange Rates 1 | Math Clip Art--Applications of Proportions--Exchange Rates 1 This is a collection of clip art images that show an application of proportional reasoning in the context of currency exchange rates. |
Ratios and Rates and Proportions |
|
Math Clip Art--Applications of Proportions--Exchange Rates 10 | Math Clip Art--Applications of Proportions--Exchange Rates 10 This is a collection of clip art images that show an application of proportional reasoning in the context of currency exchange rates. |
Ratios and Rates and Proportions |
|
Math Clip Art--Applications of Proportions--Exchange Rates 11 | Math Clip Art--Applications of Proportions--Exchange Rates 11 This is a collection of clip art images that show an application of proportional reasoning in the context of currency exchange rates. |
Ratios and Rates and Proportions |

|
Math Clip Art--Applications of Proportions--Exchange Rates 2 | Math Clip Art--Applications of Proportions--Exchange Rates 2 This is a collection of clip art images that show an application of proportional reasoning in the context of currency exchange rates. |
Ratios and Rates and Proportions |

|
Math Clip Art--Applications of Proportions--Exchange Rates 3 | Math Clip Art--Applications of Proportions--Exchange Rates 3 This is a collection of clip art images that show an application of proportional reasoning in the context of currency exchange rates. |
Ratios and Rates and Proportions |
|
Math Clip Art--Applications of Proportions--Exchange Rates 4 | Math Clip Art--Applications of Proportions--Exchange Rates 4 This is a collection of clip art images that show an application of proportional reasoning in the context of currency exchange rates. |
Ratios and Rates and Proportions |
|
Math Clip Art--Applications of Proportions--Exchange Rates 5 | Math Clip Art--Applications of Proportions--Exchange Rates 5 This is a collection of clip art images that show an application of proportional reasoning in the context of currency exchange rates. |
Ratios and Rates and Proportions |
|
Math Clip Art--Applications of Proportions--Exchange Rates 6 | Math Clip Art--Applications of Proportions--Exchange Rates 6 This is a collection of clip art images that show an application of proportional reasoning in the context of currency exchange rates. |
Ratios and Rates and Proportions |
|
Math Clip Art--Applications of Proportions--Exchange Rates 7 | Math Clip Art--Applications of Proportions--Exchange Rates 7 This is a collection of clip art images that show an application of proportional reasoning in the context of currency exchange rates. |
Ratios and Rates and Proportions |
|
Math Clip Art--Applications of Proportions--Exchange Rates 8 | Math Clip Art--Applications of Proportions--Exchange Rates 8 This is a collection of clip art images that show an application of proportional reasoning in the context of currency exchange rates. |
Ratios and Rates and Proportions |
|
Math Clip Art--Applications of Proportions--Exchange Rates 9 | Math Clip Art--Applications of Proportions--Exchange Rates 9 This is a collection of clip art images that show an application of proportional reasoning in the context of currency exchange rates. |
Ratios and Rates and Proportions |
|
Math Clip Art--Equivalent Ratios: Cooking 1 | Math Clip Art--Equivalent Ratios: Cooking 1TopicRatios DescriptionThis math clip art image serves as a title card for a series on equivalent ratios in cooking. It features a decorative design with the title "Equivalent Recipes" along with illustrations of flour and various kitchen utensils. This visual introduction is crucial for setting the context and engaging students in the upcoming lesson on ratios in a practical, real-world scenario. |
Ratios and Rates |
|
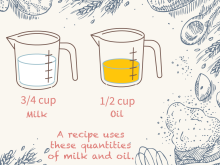
Math Clip Art--Equivalent Ratios: Cooking 2 | Math Clip Art--Equivalent Ratios: Cooking 2TopicRatios DescriptionThis math clip art image shows an illustration of two measuring cups: one containing 3/4 cup of milk and another with 1/2 cup of oil. This visual representation is crucial for introducing the concept of ratios in a practical, cooking-related context. The image effectively demonstrates how ratios can be represented using real-world measurements. By showing two different ingredients in specific quantities, it helps students visualize the concept of comparing two quantities. This concrete representation can make the abstract concept of ratios more tangible and easier to understand. |
Ratios and Rates |
|
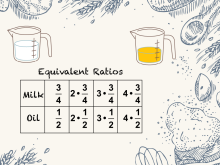
Math Clip Art--Equivalent Ratios: Cooking 3 | Math Clip Art--Equivalent Ratios: Cooking 3TopicRatios DescriptionThis math clip art image presents a table of equivalent ratios for milk and oil, multiplying both quantities by 2, 3, and 4. This visual representation is essential for teaching the concept of equivalent ratios and scaling recipes. |
Ratios and Rates |
|
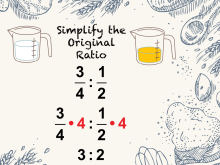
Math Clip Art--Equivalent Ratios: Cooking 4 | Math Clip Art--Equivalent Ratios: Cooking 4TopicRatios DescriptionThis math clip art image illustrates the process of simplifying ratios in a cooking context. It shows the steps to simplify the original ratio of milk to oil from 3/4 : 1/2 to 3 : 2 by multiplying both terms by 4. This visual representation helps students understand how equivalent ratios work and how they can be simplified to their most basic form. |
Ratios and Rates |
|
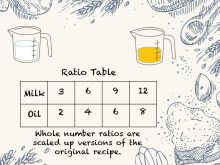
Math Clip Art--Equivalent Ratios: Cooking 5 | Math Clip Art--Equivalent Ratios: Cooking 5TopicRatios DescriptionThis math clip art presents a ratio table with illustrations of measuring cups containing milk and oil, displaying whole number ratios. The image effectively demonstrates how whole number ratios are scaled-up versions of the original recipe, making it easier for students to visualize and understand the concept of equivalent ratios in a practical context. |
Ratios and Rates |
|
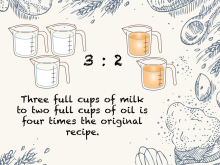
Math Clip Art--Equivalent Ratios: Cooking 6 | Math Clip Art--Equivalent Ratios: Cooking 6TopicRatios DescriptionThis math clip art image visually represents a 3:2 ratio using measuring cups filled with milk and oil. It shows three full cups of milk alongside two full cups of oil, illustrating that this ratio is four times the original recipe. This concrete representation helps students understand how equivalent ratios work in real-world contexts, particularly in cooking scenarios. |
Ratios and Rates |
|
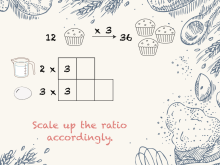
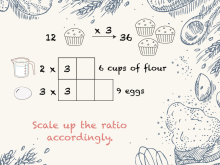
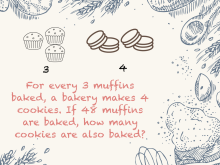
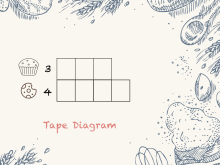
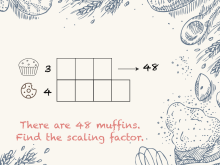
Math Clip Art--Rates and Tape Diagrams: Cooking 1 | Math Clip Art--Rates and Tape Diagrams: Cooking 1 This is a collection of clip art images that show how to use tape diagrams to solve ratio and rate problems. |
Ratios and Rates |
|
Math Clip Art--Rates and Tape Diagrams: Cooking 10 | Math Clip Art--Rates and Tape Diagrams: Cooking 10 This is a collection of clip art images that show how to use tape diagrams to solve ratio and rate problems. |
Ratios and Rates |
|
Math Clip Art--Rates and Tape Diagrams: Cooking 11 | Math Clip Art--Rates and Tape Diagrams: Cooking 11 This is a collection of clip art images that show how to use tape diagrams to solve ratio and rate problems. |
Ratios and Rates |
|
Math Clip Art--Rates and Tape Diagrams: Cooking 2 | Math Clip Art--Rates and Tape Diagrams: Cooking 2 This is a collection of clip art images that show how to use tape diagrams to solve ratio and rate problems. |
Ratios and Rates |
|
Math Clip Art--Rates and Tape Diagrams: Cooking 3 | Math Clip Art--Rates and Tape Diagrams: Cooking 3 This is a collection of clip art images that show how to use tape diagrams to solve ratio and rate problems. |
Ratios and Rates |
|
Math Clip Art--Rates and Tape Diagrams: Cooking 4 | Math Clip Art--Rates and Tape Diagrams: Cooking 4 This is a collection of clip art images that show how to use tape diagrams to solve ratio and rate problems. |
Ratios and Rates |
|
Math Clip Art--Rates and Tape Diagrams: Cooking 5 | Math Clip Art--Rates and Tape Diagrams: Cooking 5 This is a collection of clip art images that show how to use tape diagrams to solve ratio and rate problems. |
Ratios and Rates |
|
Math Clip Art--Rates and Tape Diagrams: Cooking 6 | Math Clip Art--Rates and Tape Diagrams: Cooking 6 This is a collection of clip art images that show how to use tape diagrams to solve ratio and rate problems. |
Ratios and Rates |
|
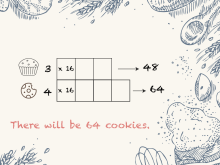
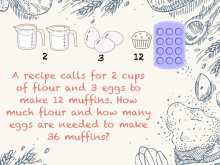
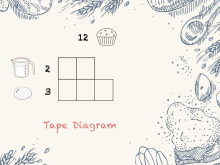
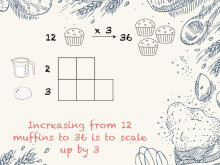
Math Clip Art--Rates and Tape Diagrams: Cooking 7 | Math Clip Art--Rates and Tape Diagrams: Cooking 7 This is a collection of clip art images that show how to use tape diagrams to solve ratio and rate problems. |
Ratios and Rates |
|
Math Clip Art--Rates and Tape Diagrams: Cooking 8 | Math Clip Art--Rates and Tape Diagrams: Cooking 8 This is a collection of clip art images that show how to use tape diagrams to solve ratio and rate problems. |
Ratios and Rates |
|
Math Clip Art--Rates and Tape Diagrams: Cooking 9 | Math Clip Art--Rates and Tape Diagrams: Cooking 9 This is a collection of clip art images that show how to use tape diagrams to solve ratio and rate problems. |
Ratios and Rates |
|
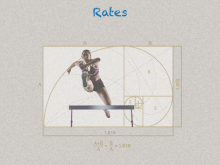
Math Clip Art--Ratios, Proportions, Percents--Rates 01 | Math Clip Art--Ratios, Proportions, Percents--Rates 01TopicRatios, Proportions, and Percents DescriptionThe image shows a hurdler jumping over a hurdle, with an overlay of the golden ratio (1.618). It introduces the concept of rates by visually showing motion and proportions. This image sets the stage for understanding rates as a mathematical relationship and connects to the idea of proportion and efficiency, aligning with rates' use in describing relationships. Ratios, Proportions, and Percents focuses on understanding and applying the concept of rates, which are comparisons of two quantities with different units. |
Ratios and Rates |
|
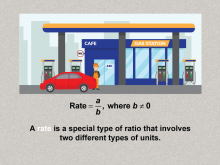
Math Clip Art--Ratios, Proportions, Percents--Rates 02 | Math Clip Art--Ratios, Proportions, Percents--Rates 02TopicRatios, Proportions, and Percents DescriptionThe image depicts a gas station with the formula Rate = a / b, where b ≠ 0, defining rate as a ratio of two different units. It introduces the formal definition of rates, providing a foundation for subsequent examples that apply this definition in real-world contexts. Ratios, Proportions, and Percents focuses on understanding and applying the concept of rates, which are comparisons of two quantities with different units. |
Ratios and Rates |
|
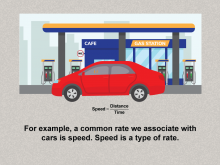
Math Clip Art--Ratios, Proportions, Percents--Rates 03 | Math Clip Art--Ratios, Proportions, Percents--Rates 03TopicRatios, Proportions, and Percents DescriptionThe image shows a car at a gas station with the formula Speed = Distance / Time, explaining speed as a specific example of rate. It connects the abstract concept of rates to a concrete example (speed), making the topic relatable and easier to understand. Ratios, Proportions, and Percents focuses on understanding and applying the concept of rates, which are comparisons of two quantities with different units. |
Ratios and Rates |
|
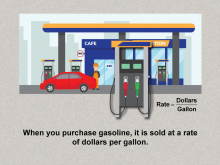
Math Clip Art--Ratios, Proportions, Percents--Rates 04 | Math Clip Art--Ratios, Proportions, Percents--Rates 04TopicRatios, Proportions, and Percents DescriptionThe image highlights a gasoline pump with the formula Rate = Dollars / Gallon, illustrating the cost of gasoline as an example of rate. It applies the concept of rates to another common scenario, reinforcing the idea of rates in daily life and extending understanding from speed to cost per unit. Ratios, Proportions, and Percents focuses on understanding and applying the concept of rates, which are comparisons of two quantities with different units. |
Ratios and Rates |
|
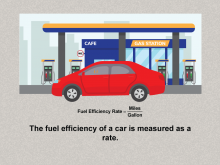
Math Clip Art--Ratios, Proportions, Percents--Rates 05 | Math Clip Art--Ratios, Proportions, Percents--Rates 05TopicRatios, Proportions, and Percents DescriptionThe image depicts a car with the formula Fuel Efficiency Rate = Miles / Gallon, explaining how fuel efficiency is measured as a rate. It introduces a third example of rates, connecting to environmental and economic considerations, and further solidifying understanding. Ratios, Proportions, and Percents focuses on understanding and applying the concept of rates, which are comparisons of two quantities with different units. |
Ratios and Rates |
|
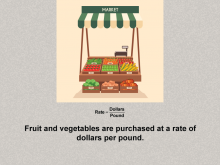
Math Clip Art--Ratios, Proportions, Percents--Rates 06 | Math Clip Art--Ratios, Proportions, Percents--Rates 06TopicRatios, Proportions, and Percents DescriptionThe image shows a fruit market with the formula Rate = Dollars / Pound, illustrating the cost of fruits and vegetables per unit weight. It expands the application of rates to another familiar scenario, demonstrating versatility in its use across contexts. Ratios, Proportions, and Percents focuses on understanding and applying the concept of rates, which are comparisons of two quantities with different units. |
Ratios and Rates |
|
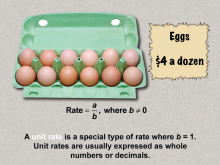
Math Clip Art--Ratios, Proportions, Percents--Rates 07 | Math Clip Art--Ratios, Proportions, Percents--Rates 07TopicRatios, Proportions, and Percents DescriptionThe image shows a carton of eggs priced at $4 a dozen, defining a unit rate where b = 1, expressed as whole numbers or decimals. It introduces the concept of unit rates, a special type of rate, laying the groundwork for calculations in subsequent images. Ratios, Proportions, and Percents focuses on understanding and applying the concept of rates, which are comparisons of two quantities with different units. |
Ratios and Rates |
|
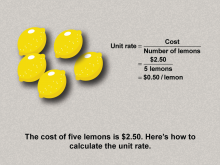
Math Clip Art--Ratios, Proportions, Percents--Rates 08 | Math Clip Art--Ratios, Proportions, Percents--Rates 08TopicRatios, Proportions, and Percents DescriptionThe image features lemons priced at $2.50 for 5, with the calculation Unit Rate = 2.50 / 5 = 0.50 per lemon. It provides a step-by-step calculation of unit rates, reinforcing the concept introduced earlier with practical application. Ratios, Proportions, and Percents focuses on understanding and applying the concept of rates, which are comparisons of two quantities with different units. |
Ratios and Rates |
|
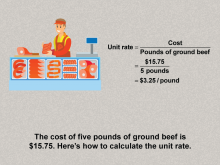
Math Clip Art--Ratios, Proportions, Percents--Rates 09 | Math Clip Art--Ratios, Proportions, Percents--Rates 09TopicRatios, Proportions, and Percents DescriptionThe image illustrates the cost of 5 pounds of ground beef at $15.75, with the calculation Unit Rate = 15.75 / 5 = 3.25 per pound. It demonstrates another example of calculating unit rates, solidifying the learner's ability to perform similar calculations. Ratios, Proportions, and Percents focuses on understanding and applying the concept of rates, which are comparisons of two quantities with different units. |
Ratios and Rates |
|
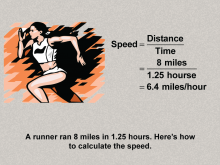
Math Clip Art--Ratios, Proportions, Percents--Rates 10 | Math Clip Art--Ratios, Proportions, Percents--Rates 10TopicRatios, Proportions, and Percents DescriptionThe image shows a runner covering 8 miles in 1.25 hours, with the calculation Speed = 8 / 1.25 = 6.4 miles/hour. It reinforces the speed example from earlier, providing another opportunity to apply the concept of rates to motion. Ratios, Proportions, and Percents focuses on understanding and applying the concept of rates, which are comparisons of two quantities with different units. |
Ratios and Rates |
|
Math Clip Art: Slope vs. Rate | Math Clip Art: Slope vs. Rate In these clip art images, show students the difference between ratios and rates. These images are useful when talking about slope as both a ratio and a rate. In particular, this is useful when talking about slope as a rate of change. |
Slope and Ratios and Rates |