
Illustrative Math Alignment: Grade 6 Unit 8
Data Sets and Distributions
Lesson 1: Got Data?
Use the following Media4Math resources with this Illustrative Math lesson.
| Thumbnail Image | Title | Body | Curriculum Nodes |
|---|---|---|---|
|
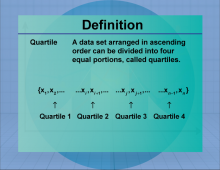
Definition--Measures of Central Tendency--Quartile | QuartileTopicStatistics DefinitionQuartiles divide a ranked data set into four equal parts. DescriptionQuartiles are used to summarize data by dividing it into four parts, each representing a quarter of the data set. They provide insight into the spread and center of data, helping to identify the distribution and variability. Quartiles are used in box plots to visually represent data distribution, making them valuable in fields such as finance and research for analyzing data trends. |
Data Analysis |
|
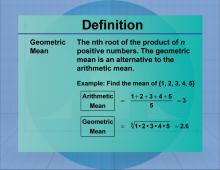
Definition--Measures of Central Tendency--Geometric Mean | Geometric MeanTopicStatistics DefinitionThe geometric mean is the nth root of the product of n numbers, used to calculate average rates of growth. DescriptionThe geometric mean is particularly useful in finance and economics for calculating compound interest and growth rates. Unlike the arithmetic mean, it is appropriate for data sets with values that are multiplicatively related. For example, the geometric mean of 2, 8, and 32 is calculated as (2 × 8 × 32)1/3 = 8. In mathematics, the geometric mean is essential for understanding exponential growth and decay. |
Data Analysis |
|
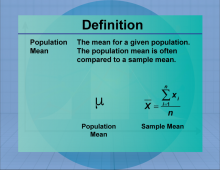
Definition--Measures of Central Tendency--Population Mean | Population MeanTopicStatistics DefinitionThe population mean is a measure of central tendency that provides an average representation of a set of data. DescriptionThe Population Mean is an important concept in statistics, used to summarize data effectively. It is meant to represent the mean for a given statistic for an entire population. For example, the mean length of a salmon. |
Data Analysis |
|
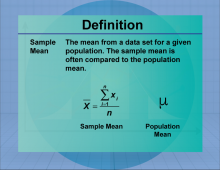
Definition--Measures of Central Tendency--Sample Mean | Sample MeanTopicStatistics DefinitionThe sample mean is the average of a sample, calculated by summing the sample values and dividing by the sample size. DescriptionThe sample mean is a measure of central tendency that provides an estimate of the population mean based on a sample. It is widely used in statistics for making inferences about populations from samples, playing a crucial role in hypothesis testing and confidence interval estimation. The sample mean is used in fields such as economics, biology, and psychology to analyze data and draw conclusions about larger populations. |
Data Analysis |
|
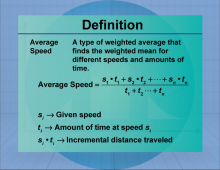
Definition--Measures of Central Tendency--Average Speed | Average SpeedTopicStatistics DefinitionAverage speed is the total distance traveled divided by the total time taken. DescriptionThis concept finds application in areas such as physics, transport, and everyday scenarios like calculating travel time. For example, if a car travels 300 km in 3 hours, the average speed is Average Speed = 300 km / 3 hours = 100 km/h. Understanding average speed is key in mathematics as it helps contextualize rate and distance problems in real-life situations. |
Data Analysis |
|
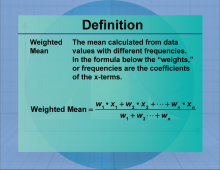
Definition--Measures of Central Tendency--Weighted Mean | Weighted MeanTopicStatistics DefinitionThe weighted mean is the average of a data set where each value is multiplied by a weight reflecting its importance. DescriptionThe weighted mean is used when different data points contribute unequally to the final average. It is commonly applied in finance to calculate portfolio returns, in education to compute weighted grades, and in various fields where data points have different levels of significance. The weighted mean provides a more accurate representation of data by considering the relative importance of each value. |
Data Analysis |
|
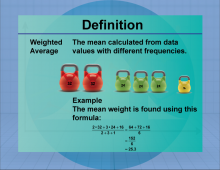
Definition--Measures of Central Tendency--Weighted Average | Weighted AverageTopicStatistics DefinitionA weighted average is an average that takes into account the relative importance of each value, calculated by multiplying each value by its weight and summing the results. DescriptionThe weighted average is used when different data points contribute unequally to the final average. It is commonly applied in finance to calculate portfolio returns, in education to compute weighted grades, and in various fields where data points have different levels of significance. The weighted average provides a more accurate representation of data by considering the relative importance of each value. |
Data Analysis |
|
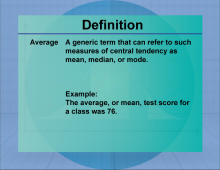
Definition--Measures of Central Tendency--Average | AverageTopicStatistics DefinitionThe average is a measure of central tendency, calculated by dividing the sum of values by their count. DescriptionIn statistics, the average is crucial for analyzing data sets, revealing trends, and providing insight into overall performance. It’s applicable in various fields, from school grades to business metrics. For example, if a student scores 80, 90, and 100 on three exams, the average can be calculated as follows: Average = (80 + 90 + 100) / 3 = 90. The average is essential in math education as it forms a foundational concept for more advanced statistical analyses. |
Data Analysis |
|
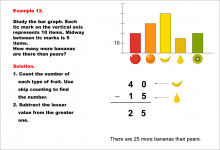
Math Example--Charts, Graphs, and Plots--Reading and Interpreting Scaled Graphs--Example 12 | Math Example--Charts, Graphs, and Plots-- Reading and Interpreting Scaled Graphs--Example 12
In this set of math examples, analyze the behavior of different scatterplots. This includes linear and quadratic models. |
Subtraction Facts to 100 and Data Analysis |

|
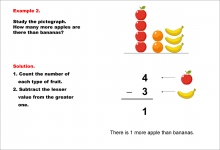
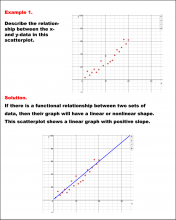
Math Example--Charts, Graphs, and Plots--Reading and Interpreting Scaled Graphs--Example 1 | Math Example--Charts, Graphs, and Plots-- Reading and Interpreting Scaled Graphs--Example 1
In this set of math examples, analyze the behavior of different scatterplots. This includes linear and quadratic models. |
Subtraction Facts to 100 and Data Analysis |
|
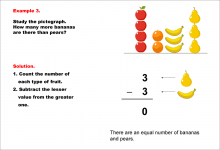
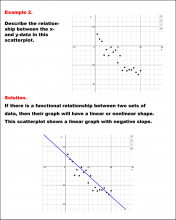
Math Example--Charts, Graphs, and Plots--Reading and Interpreting Scaled Graphs--Example 2 | Math Example--Charts, Graphs, and Plots-- Reading and Interpreting Scaled Graphs--Example 2
In this set of math examples, analyze the behavior of different scatterplots. This includes linear and quadratic models. |
Subtraction Facts to 100 and Data Analysis |
|
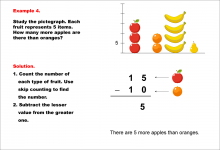
Math Example--Charts, Graphs, and Plots--Reading and Interpreting Scaled Graphs--Example 3 | Math Example--Charts, Graphs, and Plots-- Reading and Interpreting Scaled Graphs--Example 3
In this set of math examples, analyze the behavior of different scatterplots. This includes linear and quadratic models. |
Subtraction Facts to 100 and Data Analysis |
|
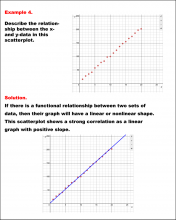
Math Example--Charts, Graphs, and Plots--Reading and Interpreting Scaled Graphs--Example 4 | Math Example--Charts, Graphs, and Plots-- Reading and Interpreting Scaled Graphs--Example 4
In this set of math examples, analyze the behavior of different scatterplots. This includes linear and quadratic models. |
Subtraction Facts to 100 and Data Analysis |
|
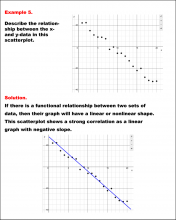
Math Example--Charts, Graphs, and Plots--Reading and Interpreting Scaled Graphs--Example 5 | Math Example--Charts, Graphs, and Plots-- Reading and Interpreting Scaled Graphs--Example 5
In this set of math examples, analyze the behavior of different scatterplots. This includes linear and quadratic models. |
Subtraction Facts to 100 and Data Analysis |
|
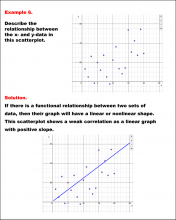
Math Example--Charts, Graphs, and Plots--Reading and Interpreting Scaled Graphs--Example 6 | Math Example--Charts, Graphs, and Plots-- Reading and Interpreting Scaled Graphs--Example 6
In this set of math examples, analyze the behavior of different scatterplots. This includes linear and quadratic models. |
Subtraction Facts to 100 and Data Analysis |
|
Math Example--Charts, Graphs, and Plots--Reading and Interpreting Scaled Graphs--Example 8 | Math Example--Charts, Graphs, and Plots-- Reading and Interpreting Scaled Graphs--Example 8
In this set of math examples, analyze the behavior of different scatterplots. This includes linear and quadratic models. |
Subtraction Facts to 100 and Data Analysis |
|
Math Example--Charts, Graphs, and Plots--Reading and Interpreting Scaled Graphs--Example 9 | Math Example--Charts, Graphs, and Plots-- Reading and Interpreting Scaled Graphs--Example 9
In this set of math examples, analyze the behavior of different scatterplots. This includes linear and quadratic models. |
Subtraction Facts to 100 and Data Analysis |
|
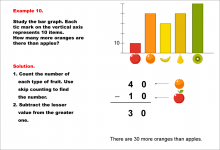
Math Example--Charts, Graphs, and Plots--Reading and Interpreting Scaled Graphs--Example 10 | Math Example--Charts, Graphs, and Plots-- Reading and Interpreting Scaled Graphs--Example 10
In this set of math examples, analyze the behavior of different scatterplots. This includes linear and quadratic models. |
Subtraction Facts to 100 and Data Analysis |
|
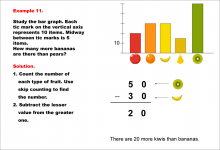
Math Example--Charts, Graphs, and Plots--Reading and Interpreting Scaled Graphs--Example 11 | Math Example--Charts, Graphs, and Plots-- Reading and Interpreting Scaled Graphs--Example 11
In this set of math examples, analyze the behavior of different scatterplots. This includes linear and quadratic models. |
Subtraction Facts to 100 and Data Analysis |
|
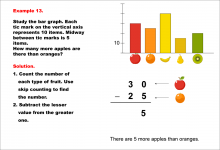
Math Example--Charts, Graphs, and Plots--Reading and Interpreting Scaled Graphs--Example 13 | Math Example--Charts, Graphs, and Plots-- Reading and Interpreting Scaled Graphs--Example 13
In this set of math examples, analyze the behavior of different scatterplots. This includes linear and quadratic models. |
Subtraction Facts to 100 and Data Analysis |
|
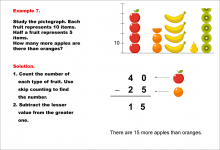
Math Example--Charts, Graphs, and Plots--Reading and Interpreting Scaled Graphs--Example 7 | Math Example--Charts, Graphs, and Plots-- Reading and Interpreting Scaled Graphs--Example 7
In this set of math examples, analyze the behavior of different scatterplots. This includes linear and quadratic models. |
Subtraction Facts to 100 and Data Analysis |
|
Closed Captioned Video: Algebra Nspirations: Data Analysis and Probability | Closed Captioned Video: Algebra Nspirations: Data Analysis and Probability
What are the two meanings of statistics? What does it really mean that an event has a 50% probability of occurring? Why are data analysis and probability always taught together? Written and hosted by internationally acclaimed math educator Dr. Monica Neagoy, this video answers these questions and addresses fundamental concepts such as the law of large numbers and the notion of regression analysis. Both engaging investigations are based on true stories and real data, utilize different Nspire applications, and model the seamless connection among various problem representations. Concepts explored: statistics, data analysis, regression analysis. |
Data Analysis and Data Gathering |
|
Closed Captioned Video: Algebra Nspirations: Data Analysis and Probability, 1 | Closed Captioned Video: Algebra Nspirations: Data Analysis and Probability, Segment 1
In this Investigation we explore uncertainty and randomness. This video is Segment 1 of a 4 segment series related to Data Analysis and Probability. Segments 1 and 2 are grouped together. |
Data Analysis and Data Gathering |
|
Closed Captioned Video: Algebra Nspirations: Data Analysis and Probability, 3 | Closed Captioned Video: Algebra Nspirations: Data Analysis and Probability, Segment 3
In this Investigation we look at real-world data involving endangered wolf populations. This video is Segment 3 of a 4 segment series related to Data Analysis and Probability. Segments 3 and 4 are grouped together. |
Data Analysis and Data Gathering |
|
Closed Captioned Video: Algebra Applications: Data Analysis | Closed Captioned Video: Algebra Applications: Data AnalysisTopicData Analysis |
Data Analysis and Data Gathering |

|
Closed Captioned Video: Algebra Applications: Data Analysis, 1 | Closed Captioned Video: Algebra Applications: Data Analysis, 1TopicData Analysis DescriptionThis segment introduces the 2008 mortgage crisis, explaining how mortgage defaults caused widespread economic repercussions, including a recession. It outlines basic mortgage concepts such as loan amount, interest rate, and repayment periods. Key terms include mortgage, interest rate, and amortization. The segment sets the stage for exploring how specific mortgage types, like subprime loans, led to financial instability. |
Data Analysis and Data Gathering |
|
Closed Captioned Video: Algebra Applications: Data Analysis, 2 | Closed Captioned Video: Algebra Applications: Data Analysis, 2TopicData Analysis DescriptionThe video defines a mortgage as a long-term loan used to purchase a home and explains its components: loan amount, interest rate, and payment periods. Through examples, it demonstrates how interest rates impact total loan costs. Key concepts include amortization, equity, and principal versus interest payments. Applications involve using financial calculators to analyze repayment schedules and equity growth, emphasizing the importance of interest rates. |
Data Analysis and Data Gathering |
|
Closed Captioned Video: Algebra Applications: Data Analysis, 3 | Closed Captioned Video: Algebra Applications: Data Analysis, 3TopicData Analysis DescriptionThis segment explains subprime mortgages, emphasizing how credit scores affect loan interest rates. It compares repayment scenarios for borrowers with different FICO scores, showing the financial challenges of subprime loans. Key terms include subprime mortgage, credit risk, and delinquency. The video uses simulations to illustrate the likelihood and impact of loan defaults, linking these trends to the mortgage crisis. |
Data Analysis and Data Gathering |
|
Closed Captioned Video: Algebra Applications: Data Analysis, 4 | Closed Captioned Video: Algebra Applications: Data Analysis, 4TopicData Analysis DescriptionAdjustable-rate mortgages (ARMs) are discussed, focusing on their role in the 2008 crisis. It demonstrates how variable rates increase long-term costs and create financial risks. Concepts include loan balance, refinancing, and amortization. The video uses spreadsheets to show payment changes over time and their economic effects. Applications highlight real-world implications of rising interest rates and decreasing home values. |
Data Analysis and Data Gathering |

|
Closed Captioned Video: Algebra Applications: Linear Functions, 3 | Closed Captioned Video: Algebra Applications: Linear Functions, 3TopicLinear Functions DescriptionUses linear regression to analyze US oil consumption trends, projecting future usage and potential impact of Alaskan oil production. This video explores the mathematics behind Linear Functions, providing clear examples and engaging visuals to enhance understanding. It is an excellent resource for both introduction and reinforcement of key concepts. |
Special Functions and Applications of Linear Functions |
|
Closed Captioned Video: Ratios and Rates: Rates from Data | Closed Captioned Video: Ratios and Rates: Rates from DataTopicRatios DescriptionThis video demonstrates calculating rates from data sets, focusing on patterns like distance-time relationships and wages. Examples include determining car speeds, hourly wages, and unit costs of gasoline. Data tables are used to visualize and compute rates. |
Ratios and Rates |
|
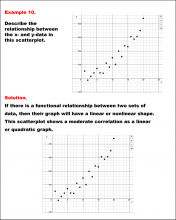
Math Example--Charts, Graphs, and Plots--Analyzing Scatterplots: Example 10 | Math Example--Charts, Graphs, and Plots-- Analyzing Scatterplots: Example 10
In this set of math examples, analyze the behavior of different scatterplots. This includes linear and quadratic models. |
Data Analysis |
|
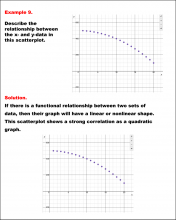
Math Example--Charts, Graphs, and Plots--Analyzing Scatterplots: Example 9 | Math Example--Charts, Graphs, and Plots-- Analyzing Scatterplots: Example 9
In this set of math examples, analyze the behavior of different scatterplots. This includes linear and quadratic models. |
Data Analysis |
|
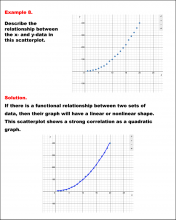
Math Example--Charts, Graphs, and Plots--Analyzing Scatterplots: Example 8 | Math Example--Charts, Graphs, and Plots-- Analyzing Scatterplots: Example 8
In this set of math examples, analyze the behavior of different scatterplots. This includes linear and quadratic models. |
Data Analysis |
|
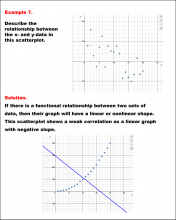
Math Example--Charts, Graphs, and Plots--Analyzing Scatterplots: Example 7 | Math Example--Charts, Graphs, and Plots-- Analyzing Scatterplots: Example 7
In this set of math examples, analyze the behavior of different scatterplots. This includes linear and quadratic models. |
Data Analysis |
|
Math Example--Charts, Graphs, and Plots--Analyzing Scatterplots: Example 6 | Math Example--Charts, Graphs, and Plots-- Analyzing Scatterplots: Example 6
In this set of math examples, analyze the behavior of different scatterplots. This includes linear and quadratic models. |
Data Analysis |
|
Math Example--Charts, Graphs, and Plots--Analyzing Scatterplots: Example 5 | Math Example--Charts, Graphs, and Plots-- Analyzing Scatterplots: Example 5
In this set of math examples, analyze the behavior of different scatterplots. This includes linear and quadratic models. |
Data Analysis |
|
Math Example--Charts, Graphs, and Plots--Analyzing Scatterplots: Example 4 | Math Example--Charts, Graphs, and Plots-- Analyzing Scatterplots: Example 4
In this set of math examples, analyze the behavior of different scatterplots. This includes linear and quadratic models. |
Data Analysis |

|
Math Example--Charts, Graphs, and Plots--Analyzing Scatterplots: Example 3 | Math Example--Charts, Graphs, and Plots-- Analyzing Scatterplots: Example 3
In this set of math examples, analyze the behavior of different scatterplots. This includes linear and quadratic models. |
Data Analysis |
|
Math Example--Charts, Graphs, and Plots--Analyzing Scatterplots: Example 2 | Math Example--Charts, Graphs, and Plots-- Analyzing Scatterplots: Example 2
In this set of math examples, analyze the behavior of different scatterplots. This includes linear and quadratic models. |
Data Analysis |
|
Math Example--Charts, Graphs, and Plots--Analyzing Scatterplots: Example 1 | Math Example--Charts, Graphs, and Plots-- Analyzing Scatterplots: Example 1
In this set of math examples, analyze the behavior of different scatterplots. This includes linear and quadratic models. |
Data Analysis |
|
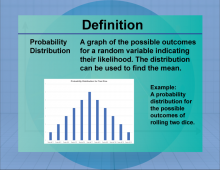
Definition--Measures of Central Tendency--Probability Distribution | Probability DistributionTopicStatistics DefinitionA probability distribution describes how the values of a random variable are distributed. DescriptionProbability distributions are fundamental in statistics, providing a mathematical function that gives the probabilities of occurrence of different possible outcomes for an experiment. They are used in various fields such as finance, science, and engineering to model uncertainty and variability. For instance, the normal distribution is a common probability distribution that describes many natural phenomena. |
Data Analysis |
|
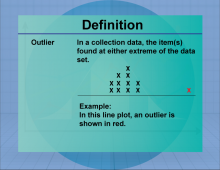
Definition--Measures of Central Tendency--Outlier | OutlierTopicStatistics DefinitionThe outlier is is an extreme value for a data set. DescriptionThe Outlier is an important concept in statistics. While it doesn't represent the average data set, it does set the range of extreme values in the data set. An outlier can be extremely large or small. In mathematics education, understanding outlier is crucial as it lays the foundation for more advanced statistical concepts. It allows students to grasp the significance of data analysis and interpretation. In classes, students often perform exercises calculating the mean of sets, which enhances their understanding of averaging techniques. |
Data Analysis |
|
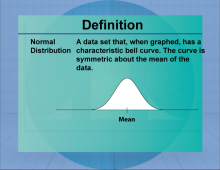
Definition--Measures of Central Tendency--Normal Distribution | Normal DistributionTopicStatistics DefinitionThe normal distribution is a measure of central tendency that provides an average representation of a set of data. DescriptionThe Normal Distribution is an important concept in statistics, used to summarize data effectively. In real-world applications, the Normal Distribution helps to interpret data distributions and is widely used in areas such as economics, social sciences, and research. |
Data Analysis |
|
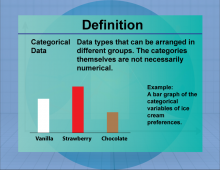
Definition--Measures of Central Tendency--Categorical Data | Categorical DataTopicStatistics DefinitionCategorical data refers to data that can be divided into specific categories or groups. DescriptionCategorical data is essential for organizing and analyzing information that falls into distinct categories, such as gender, race, or product type. This type of data is often used in market research, social sciences, and public health studies to identify patterns and relationships between groups. In mathematics, understanding categorical data is crucial for interpreting bar charts, pie charts, and frequency tables. |
Data Analysis |
|
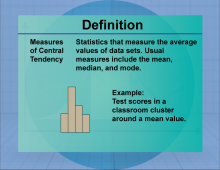
Definition--Measures of Central Tendency | Measures of Central TendencyTopicStatistics DefinitionThe measures of central tendency is a measure of central tendency that provides an average representation of a set of data. DescriptionThe Measures of Central Tendency is an important concept in statistics, used to summarize data effectively. In real-world applications, the Measures of Central Tendency helps to interpret data distributions and is widely used in areas such as economics, social sciences, and research. For example, if a data set consists of the values 2, 3, and 10, the mean is calculated as (2 + 3 + 10)/3 = 5. |
Data Analysis |
|
Worksheet: The Language of Math: Multiplication Equations, Worksheet 3 | Worksheet: The Language of Math: Multiplication Equations, Worksheet 3
This is part of a collection of math worksheets on the topic of the language of math in which students translate verbal expressions into numerical expressions and then perform the calculations. To see the complete worksheet collection on this topic, click on this link. Note: The download is a PDF file.Related ResourcesTo see additional resources on this topic, click on the Related Resources tab.Worksheet LibraryTo see the complete collection of Worksheets, click on this link. |
Numerical and Algebraic Expressions |
|
|
Worksheet: The Language of Math: Multiplication Equations, Worksheet 1 | Worksheet: The Language of Math: Multiplication Equations, Worksheet 1
This is part of a collection of math worksheets on the topic of the language of math in which students translate verbal expressions into numerical expressions and then perform the calculations. To see the complete worksheet collection on this topic, click on this link. Note: The download is a PDF file.Related ResourcesTo see additional resources on this topic, click on the Related Resources tab.Worksheet LibraryTo see the complete collection of Worksheets, click on this link. |
Numerical and Algebraic Expressions |
|
|
Worksheet: The Language of Math: Multiplication Equations, Worksheet 2 | Worksheet: The Language of Math: Multiplication Equations, Worksheet 2
This is part of a collection of math worksheets on the topic of the language of math in which students translate verbal expressions into numerical expressions and then perform the calculations. To see the complete worksheet collection on this topic, click on this link. Note: The download is a PDF file.Related ResourcesTo see additional resources on this topic, click on the Related Resources tab.Worksheet LibraryTo see the complete collection of Worksheets, click on this link. |
Numerical and Algebraic Expressions |
|
|
Worksheet: The Language of Math: Multiplication Equations, Worksheet 4 | Worksheet: The Language of Math: Multiplication Equations, Worksheet 4
This is part of a collection of math worksheets on the topic of the language of math in which students translate verbal expressions into numerical expressions and then perform the calculations. To see the complete worksheet collection on this topic, click on this link. Note: The download is a PDF file.Related ResourcesTo see additional resources on this topic, click on the Related Resources tab.Worksheet LibraryTo see the complete collection of Worksheets, click on this link. |
Numerical and Algebraic Expressions |