
Illustrative Math Alignment: Grade 7 Unit 8
Probability and Sampling
Lesson 7: Simulating Multi-step Experiments
Use the following Media4Math resources with this Illustrative Math lesson.
| Thumbnail Image | Title | Body | Curriculum Topic |
|---|---|---|---|

|
SAT Math Lesson Plan 13: Probability and Combinatorics |
|
Probability |

|
SAT Math Lesson Plan 14: Advanced Probability and Expected Value | SAT Math Lesson Plan 14: Advanced Probability and Expected Value Lesson 14 in this SAT Math Prep series explores advanced probability and expected value—topics that account for approximately 5–7% of SAT Math questions. Students will learn how to interpret discrete probability distributions, calculate expected values, and apply these concepts to real-world contexts such as financial risk, fairness in games, and strategic decision-making. This 45-minute lesson includes a Warm-Up activity, six fully worked-out instructional examples, a Review section with practice problems, and a 10-question multiple-choice quiz with a detailed answer key. Concepts such as weighted averages, compound events, and conditional reasoning are covered in depth. This lesson aligns with Common Core standards and builds statistical reasoning skills that are critical to success on the SAT and beyond. |
Probability |

|
Video Transcript: Algebra Nspirations: Data Analysis and Probability | Video Transcript: Algebra Nspirations: Data Analysis and Probability
This is the transcript for the video of same title. Video contents: What are the two meanings of statistics? What does it really mean that an event has a 50% probability of occurring? Why are data analysis and probability always taught together? Written and hosted by internationally acclaimed math educator Dr. Monica Neagoy, this video answers these questions and addresses fundamental concepts such as the law of large numbers and the notion of regression analysis. Both engaging investigations are based on true stories and real data, utilize different TI-Nspire iPad Applications, and model the seamless connection among various problem representations. Concepts explored: statistics, data analysis, regression analysis |
Data Analysis |
|
|
Video Transcript: Algebra Nspirations: Data Analysis and Probability, 1 | Video Transcript: Algebra Nspirations: Data Analysis and Probability, Part 1
This is the transcript for the video of same title. Video contents: In this Investigation we explore uncertainty and randomness. This is part of a collection of video transcript from the Algebra Nspirations video series. To see the complete collection of transcripts, click on this link. Note: The download is a PDF file. Video Transcript LibraryTo see the complete collection of video transcriptsy, click on this link. |
Data Analysis |
|
|
Video Transcript: Algebra Nspirations: Data Analysis and Probability, 2 | Video Transcript: Algebra Nspirations: Data Analysis and Probability, Part 2
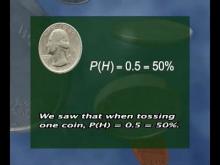
This is the transcript for the video of same title. Video contents: In this Math Lab a hands-on probability activity involving coins is explored. This is part of a collection of video transcript from the Algebra Nspirations video series. To see the complete collection of transcripts, click on this link. Note: The download is a PDF file. Video Transcript LibraryTo see the complete collection of video transcriptsy, click on this link. |
Data Analysis |
|
VIDEO: Algebra Nspirations: Data Analysis and Probability, 1 | VIDEO: Algebra Nspirations: Data Analysis and Probability, 1
TopicData Analysis DescriptionThis video introduces probability and statistics, differentiating between the two fields through historical context and practical applications. Concepts like the law of large numbers and randomness are explored using tools like the TI-Nspire. Key vocabulary includes probability, randomness, statistics, and law of large numbers. Applications include analyzing probabilities in real-world scenarios such as lightning strikes and coin flips. |
Data Analysis and Data Gathering |
|
VIDEO: Algebra Nspirations: Data Analysis and Probability, 2 | VIDEO: Algebra Nspirations: Data Analysis and Probability, 2
TopicData Analysis DescriptionIn this Math Lab video, students explore the probability distribution from tossing two coins. This video provides an in-depth look at Data Analysis by exploring real-world applications. It delves into in this math lab video, students explore the probability distribution from tossing two coins. The relevance of this video to the topic lies in its ability to connect theoretical concepts to practical scenarios. Students will gain insights into how these mathematical ideas are applied in data analysis. |
Data Analysis and Data Gathering |
|
VIDEO: Algebra Nspirations: Data Analysis and Probability, 3 | VIDEO: Algebra Nspirations: Data Analysis and Probability, 3
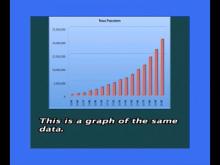
TopicData Analysis DescriptionBuilding on Part 1, this video focuses on statistical representation and interpretation. Concepts include univariate and bivariate data, regression, and data visualization techniques like bar graphs and scatter plots. Applications include analyzing dog breeds and wolf population trends using data models. Key terms include univariate, bivariate, regression, and scatter plot. |
Data Analysis and Data Gathering |
|
VIDEO: Algebra Nspirations: Data Analysis and Probability, 4 | VIDEO: Algebra Nspirations: Data Analysis and Probability, 4
TopicData Analysis DescriptionIn this Math Lab video, students explore population data. This video provides an in-depth look at Data Analysis by exploring real-world applications. It delves into in this math lab video, students explore population data. The relevance of this video to the topic lies in its ability to connect theoretical concepts to practical scenarios. Students will gain insights into how these mathematical ideas are applied in data analysis. |
Data Analysis and Data Gathering |
|
Worksheet: TI-Nspire Mini-Tutorial: A Probability Simulation of Rolling Two Dice Multiple Times (with Histogram) | Worksheet: TI-Nspire Mini-Tutorial: A Probability Simulation of Rolling Two Dice Multiple Times (with Histogram)
This is part of a collection of math worksheets on the use of the TI-Nspire graphing calculator. Each worksheet supports a companion TI-Nspire Mini-Tutorial video. It provides all the keystrokes for the activity. To see the complete worksheet collection on this topic, click on this link. Note: The download is a PDF file.Related ResourcesTo see additional resources on this topic, click on the Related Resources tab.Worksheet LibraryTo see the complete collection of Worksheets, click on this link. |
Probability |
|
|
Worksheet: TI-Nspire Mini-Tutorial: A Probability Simulation of Tossing a Coin Multiple Times (with Bar Graph) | Worksheet: TI-Nspire Mini-Tutorial: A Probability Simulation of Tossing a Coin Multiple Times (with Bar Graph)
This is part of a collection of math worksheets on the use of the TI-Nspire graphing calculator. Each worksheet supports a companion TI-Nspire Mini-Tutorial video. It provides all the keystrokes for the activity. To see the complete worksheet collection on this topic, click on this link. Note: The download is a PDF file.Related ResourcesTo see additional resources on this topic, click on the Related Resources tab.Worksheet LibraryTo see the complete collection of Worksheets, click on this link. |
Probability |
|
|
Worksheet: TI-Nspire Mini-Tutorial: A Probability Simulation of Tossing Two Coins Multiple Times (with Bar Graph) | Worksheet: TI-Nspire Mini-Tutorial: A Probability Simulation of Tossing Two Coins Multiple Times (with Bar Graph)
This is part of a collection of math worksheets on the use of the TI-Nspire graphing calculator. Each worksheet supports a companion TI-Nspire Mini-Tutorial video. It provides all the keystrokes for the activity. To see the complete worksheet collection on this topic, click on this link. Note: The download is a PDF file.Related ResourcesTo see additional resources on this topic, click on the Related Resources tab.Worksheet LibraryTo see the complete collection of Worksheets, click on this link. |
Probability |
|
|
Worksheet: TI-Nspire Mini-Tutorial: Creating a Histogram | Worksheet: TI-Nspire Mini-Tutorial: Creating a Histogram
This is part of a collection of math worksheets on the use of the TI-Nspire graphing calculator. Each worksheet supports a companion TI-Nspire Mini-Tutorial video. It provides all the keystrokes for the activity. To see the complete worksheet collection on this topic, click on this link. Note: The download is a PDF file.Related ResourcesTo see additional resources on this topic, click on the Related Resources tab.Worksheet LibraryTo see the complete collection of Worksheets, click on this link. |
Data Analysis |
|
|
Worksheet: TI-Nspire Mini-Tutorial: Creating a Random Number Table | Worksheet: TI-Nspire Mini-Tutorial: Creating a Random Number Table
This is part of a collection of math worksheets on the use of the TI-Nspire graphing calculator. Each worksheet supports a companion TI-Nspire Mini-Tutorial video. It provides all the keystrokes for the activity. To see the complete worksheet collection on this topic, click on this link. Note: The download is a PDF file.Related ResourcesTo see additional resources on this topic, click on the Related Resources tab.Worksheet LibraryTo see the complete collection of Worksheets, click on this link. |
Probability |
|
|
Worksheet: TI-Nspire Mini-Tutorial: Finding the Mean of a Data List | Worksheet: TI-Nspire Mini-Tutorial: Finding the Mean of a Data List
This is part of a collection of math worksheets on the use of the TI-Nspire graphing calculator. Each worksheet supports a companion TI-Nspire Mini-Tutorial video. It provides all the keystrokes for the activity. To see the complete worksheet collection on this topic, click on this link. Note: The download is a PDF file.Related ResourcesTo see additional resources on this topic, click on the Related Resources tab.Worksheet LibraryTo see the complete collection of Worksheets, click on this link. |
Data Analysis |
|
|
Worksheet: TI-Nspire Mini-Tutorial: Finding the Median of a Data List | Worksheet: TI-Nspire Mini-Tutorial: Finding the Median of a Data List
This is part of a collection of math worksheets on the use of the TI-Nspire graphing calculator. Each worksheet supports a companion TI-Nspire Mini-Tutorial video. It provides all the keystrokes for the activity. To see the complete worksheet collection on this topic, click on this link. Note: The download is a PDF file.Related ResourcesTo see additional resources on this topic, click on the Related Resources tab.Worksheet LibraryTo see the complete collection of Worksheets, click on this link. |
Data Analysis |
|
|
Worksheet: TI-Nspire Mini-Tutorial: Graphing a Box-and-Whisker Plot | Worksheet: TI-Nspire Mini-Tutorial: Graphing a Box-and-Whisker Plot
This is part of a collection of math worksheets on the use of the TI-Nspire graphing calculator. Each worksheet supports a companion TI-Nspire Mini-Tutorial video. It provides all the keystrokes for the activity. To see the complete worksheet collection on this topic, click on this link. Note: The download is a PDF file.Related ResourcesTo see additional resources on this topic, click on the Related Resources tab.Worksheet LibraryTo see the complete collection of Worksheets, click on this link. |
Data Analysis |
|
|
Worksheet: TI-Nspire Mini-Tutorial: Graphing a Scatterplot Using a Graphs and Geometry Window | Worksheet: TI-Nspire Mini-Tutorial: Graphing a Scatterplot Using a Graphs and Geometry Window
This is part of a collection of math worksheets on the use of the TI-Nspire graphing calculator. Each worksheet supports a companion TI-Nspire Mini-Tutorial video. It provides all the keystrokes for the activity. To see the complete worksheet collection on this topic, click on this link. Note: The download is a PDF file.Related ResourcesTo see additional resources on this topic, click on the Related Resources tab.Worksheet LibraryTo see the complete collection of Worksheets, click on this link. |
Data Analysis |
|
|
Worksheet: TI-Nspire Mini-Tutorial: Graphing a Scatterplot Using a Statistics Window | Worksheet: TI-Nspire Mini-Tutorial: Graphing a Scatterplot Using a Statistics Window
This is part of a collection of math worksheets on the use of the TI-Nspire graphing calculator. Each worksheet supports a companion TI-Nspire Mini-Tutorial video. It provides all the keystrokes for the activity. To see the complete worksheet collection on this topic, click on this link. Note: The download is a PDF file.Related ResourcesTo see additional resources on this topic, click on the Related Resources tab.Worksheet LibraryTo see the complete collection of Worksheets, click on this link. |
Data Analysis |