
Illustrative Math Alignment: Grade 8 Unit 3
Linear Relationships
Lesson 3: Representing Proportional Relationships
Use the following Media4Math resources with this Illustrative Math lesson.
| Thumbnail Image | Title | Body | Curriculum Topic |
|---|---|---|---|

|
Interactive Quiz: Solving Proportions for d, Quiz 10, Level 1 | Interactive Quiz: Solving Proportions for d, Quiz 10, Level 1
This is part of a collection of math quizzes on the topic of solving proportions. Some quizzes are interactive and some are in PDF format. To see the complete quiz collection on this topic, click on this link. Note: The download is the PDF version of the quiz (with answer key).Related ResourcesTo see additional resources on this topic, click on the Related Resources tab.Quiz LibraryTo see the complete collection of Quizzes, click on this link.
|
Proportions |
|
|
Interactive Quiz: Solving Proportions for d, Quiz 10, Level 2 | Interactive Quiz: Solving Proportions for d, Quiz 10, Level 2
This is part of a collection of math quizzes on the topic of solving proportions. Some quizzes are interactive and some are in PDF format. To see the complete quiz collection on this topic, click on this link. Note: The download is the PDF version of the quiz (with answer key).Related ResourcesTo see additional resources on this topic, click on the Related Resources tab.Quiz LibraryTo see the complete collection of Quizzes, click on this link.
|
Proportions |
|
|
Interactive Quiz: Solving Proportions for d, Quiz 10, Level 3 | Interactive Quiz: Solving Proportions for d, Quiz 10, Level 3
This is part of a collection of math quizzes on the topic of solving proportions. Some quizzes are interactive and some are in PDF format. To see the complete quiz collection on this topic, click on this link. Note: The download is the PDF version of the quiz (with answer key).Related ResourcesTo see additional resources on this topic, click on the Related Resources tab.Quiz LibraryTo see the complete collection of Quizzes, click on this link.
|
Proportions |
|
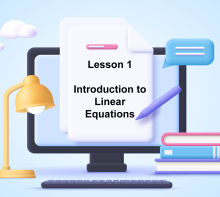
Lesson Plan--Linear Functions and Equations (MS)--Lesson 1--Introduction to Linear Equations | Lesson Plan: Introduction to Linear EquationsThis lesson is the first in a five-part series on linear equations for middle school students. It introduces the fundamental concepts of linear equations, their structure, and their applications in real-world contexts. |
Slope-Intercept Form and Standard Form |
|
|
Lesson Plan--Linear Functions and Equations (MS)--Lesson 1--Introduction to Linear Equations | Lesson Plan: Introduction to Linear EquationsThis lesson is the first in a five-part series on linear equations for middle school students. It introduces the fundamental concepts of linear equations, their structure, and their applications in real-world contexts. |
Slope-Intercept Form and Standard Form |
|
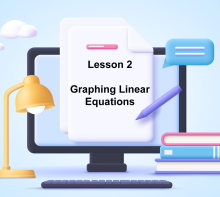
Lesson Plan--Linear Functions and Equations (MS)--Lesson 2--Graphing Linear Equations | Lesson Plan: Graphing Linear EquationsThis is the second lesson in a five-part series on linear equations. It introduces students to graphing linear equations using slope-intercept form: y=mx+b. Students will learn to identify slope and y-intercept, plot points, and interpret graphs in real-world contexts. The lesson aligns with Common Core Standards 8.EE.B.5 and 8.EE.B.6. |
Graphs of Linear Functions |

|
Lesson Plan--Linear Functions and Equations (MS)--Lesson 4--Linear Inequalities | Lesson Plan: Linear InequalitiesThis is the fourth lesson in a five-part series on linear equations and inequalities designed for middle school students. In this lesson, students explore the fundamentals of linear inequalities, including solving inequalities algebraically and graphing solution sets on the coordinate plane. Through step-by-step instruction, students learn to interpret inequality symbols, apply inverse operations, and determine whether to use solid or dashed boundary lines in graphs. The lesson includes real-world applications, such as budgeting constraints, work-hour limits, and spending allowances, demonstrating how linear inequalities are used in everyday decision-making. Aligned with Common Core Standards 6.NS.C.7a, 6.EE.B.5, 8.EE.B.5, and 8.EE.C.7b, this lesson builds on students’ prior knowledge of linear equations while introducing a broader understanding of algebraic inequalities. |
Inequalities |
|
|
Lesson Plan--Linear Functions and Equations (MS)--Lesson 4--Linear Inequalities | Lesson Plan: Linear InequalitiesThis is the fourth lesson in a five-part series on linear equations and inequalities designed for middle school students. In this lesson, students explore the fundamentals of linear inequalities, including solving inequalities algebraically and graphing solution sets on the coordinate plane. Through step-by-step instruction, students learn to interpret inequality symbols, apply inverse operations, and determine whether to use solid or dashed boundary lines in graphs. The lesson includes real-world applications, such as budgeting constraints, work-hour limits, and spending allowances, demonstrating how linear inequalities are used in everyday decision-making. Aligned with Common Core Standards 6.NS.C.7a, 6.EE.B.5, 8.EE.B.5, and 8.EE.C.7b, this lesson builds on students’ prior knowledge of linear equations while introducing a broader understanding of algebraic inequalities. |
Inequalities |

|
Lesson Plan--Ratios, Proportions, and Percents (Gr 8)--Lesson 3--Graphing and Interpreting Proportional Relationships | Lesson Plan: Graphing and Interpreting Proportional Relationships In this lesson, students will explore how to represent and analyze proportional relationships using graphs, tables, and equations. They will learn that proportional relationships follow the equation y=kx, where k is the constant of proportionality, and that these relationships always form a straight line passing through the origin on a coordinate plane. Key concepts covered in this lesson include: |
Applications of Ratios, Proportions, and Percents and Proportions |
|
|
Lesson Plan--Ratios, Proportions, and Percents (Gr 8)--Lesson 3--Graphing and Interpreting Proportional Relationships | Lesson Plan: Graphing and Interpreting Proportional Relationships In this lesson, students will explore how to represent and analyze proportional relationships using graphs, tables, and equations. They will learn that proportional relationships follow the equation y=kx, where k is the constant of proportionality, and that these relationships always form a straight line passing through the origin on a coordinate plane. Key concepts covered in this lesson include: |
Applications of Ratios, Proportions, and Percents and Proportions |

|
Lesson Plan--Ratios, Proportions, and Percents (Gr 8)--Lesson 4--Understanding Direct Variation and Its Connection to Proportional Relationships | Lesson Plan: Direct Variations In this lesson, students will explore direct variation, a special type of proportional relationship where one variable is a constant multiple of another. They will learn how to identify direct variation in tables, graphs, and equations, determine the constant of variation (k), and understand how direct variation relates to linear functions. Key concepts covered in this lesson include: |
Applications of Linear Functions and Applications of Ratios, Proportions, and Percents |

|
Lesson Plan--Slope Concepts--Lesson 1--What Is Slope? | Lesson Plan: What Is Slope? This lesson is the first in a six-part series designed to introduce middle school students to the concept of slope. Through interactive digital resources from Media4Math, students will explore how slope represents the ratio of vertical change to horizontal change between two points on a line. Key learning objectives include: Defining slope as a ratio of rise over run.Interpreting slope in real-world scenarios, such as staircases and ramps.Calculating slope using coordinate points on a graph.The lesson includes engaging digital media, practice problems, and guided activities to help students develop a strong conceptual understanding. This resource is aligned with educational standards, making it an essential part of any middle school math curriculum. Subscribers to Media4Math can download PDF versions of the lesson plan for easy classroom use. |
Slope |

|
Lesson Plan--Slope Concepts--Lesson 6--Slope as Rate of Change | Lesson Plan: Slope as Rate of Change This lesson is the sixth and final installment in Media4Math's comprehensive six-part series on understanding slope in mathematics. It focuses on interpreting slope as a rate of change between two quantities, enabling students to apply this concept to real-world scenarios and mathematical problems. |
Slope |
|
|
Lesson Plan--Slope Concepts--Lesson 6--Slope as Rate of Change | Lesson Plan: Slope as Rate of Change This lesson is the sixth and final installment in Media4Math's comprehensive six-part series on understanding slope in mathematics. It focuses on interpreting slope as a rate of change between two quantities, enabling students to apply this concept to real-world scenarios and mathematical problems. |
Slope |
|
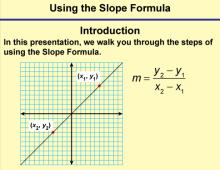
Math Clip Art--Linear Functions Concepts--Using the Slope Formula 1 | Math Clip Art--Linear Functions Concepts--Using the Slope Formula 1TopicLinear Functions DescriptionThis image is the first in a series of 6 clip art images that show step by step how to use the slope formula. It serves as an introduction, with the title "Introduction" and includes the text "In this presentation, we walk you through the steps of using the Slope Formula." The image features a linear graph with two generic points highlighted and the slope formula displayed. |
Slope and Ratios and Rates |
|
|
Math Clip Art--Linear Functions Concepts--Using the Slope Formula 1 | Math Clip Art--Linear Functions Concepts--Using the Slope Formula 1TopicLinear Functions DescriptionThis image is the first in a series of 6 clip art images that show step by step how to use the slope formula. It serves as an introduction, with the title "Introduction" and includes the text "In this presentation, we walk you through the steps of using the Slope Formula." The image features a linear graph with two generic points highlighted and the slope formula displayed. |
Slope and Ratios and Rates |
|
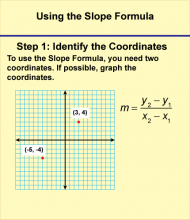
Math Clip Art--Linear Functions Concepts--Using the Slope Formula 2 | Math Clip Art--Linear Functions Concepts--Using the Slope Formula 2TopicLinear Functions DescriptionThis image is a continuation of the previous one, focusing on Step 1 of using the slope formula: "Identify the Coordinates." The example in this series of images deals with coordinates (3, 4) and (-5, -4), demonstrating how to select two points on a line to calculate its slope. Teachers can guide students through this step by saying: "The first step in using the slope formula is to identify two points on our line. In this example, we're using the points (3, 4) and (-5, -4). Can you locate these points on the graph? Why do you think it's important to choose two different points?" |
Slope and Ratios and Rates |
|
|
Math Clip Art--Linear Functions Concepts--Using the Slope Formula 2 | Math Clip Art--Linear Functions Concepts--Using the Slope Formula 2TopicLinear Functions DescriptionThis image is a continuation of the previous one, focusing on Step 1 of using the slope formula: "Identify the Coordinates." The example in this series of images deals with coordinates (3, 4) and (-5, -4), demonstrating how to select two points on a line to calculate its slope. Teachers can guide students through this step by saying: "The first step in using the slope formula is to identify two points on our line. In this example, we're using the points (3, 4) and (-5, -4). Can you locate these points on the graph? Why do you think it's important to choose two different points?" |
Slope and Ratios and Rates |
|
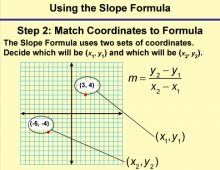
Math Clip Art--Linear Functions Concepts--Using the Slope Formula 3 | Math Clip Art--Linear Functions Concepts--Using the Slope Formula 3TopicLinear Functions DescriptionThis image continues the series, focusing on Step 2 of using the slope formula: "Match Coordinates to Formula." It demonstrates how to correctly assign the chosen coordinates to the variables in the slope formula. |
Slope and Ratios and Rates |
|
|
Math Clip Art--Linear Functions Concepts--Using the Slope Formula 3 | Math Clip Art--Linear Functions Concepts--Using the Slope Formula 3TopicLinear Functions DescriptionThis image continues the series, focusing on Step 2 of using the slope formula: "Match Coordinates to Formula." It demonstrates how to correctly assign the chosen coordinates to the variables in the slope formula. |
Slope and Ratios and Rates |
|
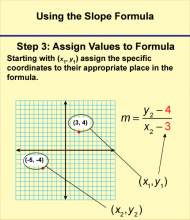
Math Clip Art--Linear Functions Concepts--Using the Slope Formula 4 | Math Clip Art--Linear Functions Concepts--Using the Slope Formula 4TopicLinear Functions DescriptionThis image focuses on Step 3 of using the slope formula: "Assign Values to Formula." It shows how to substitute the actual coordinate values into the slope formula, preparing for the calculation of the slope. |
Slope and Ratios and Rates |
|
|
Math Clip Art--Linear Functions Concepts--Using the Slope Formula 4 | Math Clip Art--Linear Functions Concepts--Using the Slope Formula 4TopicLinear Functions DescriptionThis image focuses on Step 3 of using the slope formula: "Assign Values to Formula." It shows how to substitute the actual coordinate values into the slope formula, preparing for the calculation of the slope. |
Slope and Ratios and Rates |
|
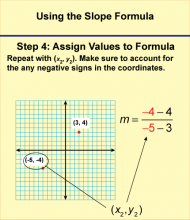
Math Clip Art--Linear Functions Concepts--Using the Slope Formula 5 | Math Clip Art--Linear Functions Concepts--Using the Slope Formula 5TopicLinear Functions DescriptionThis image continues the series, focusing on Step 4 of using the slope formula: "Assign Values to Formula." It completes the assignment of coordinate values in the slope formula. In this case we deal with x2 and y2. Teachers can walk students through this step by saying: "Now we complete the assignment of coordinate values into the slope formula. In this case we deal with x2 and y2. Do you see how those coordinates are highlighted in the formula?" |
Slope and Ratios and Rates |
|
|
Math Clip Art--Linear Functions Concepts--Using the Slope Formula 5 | Math Clip Art--Linear Functions Concepts--Using the Slope Formula 5TopicLinear Functions DescriptionThis image continues the series, focusing on Step 4 of using the slope formula: "Assign Values to Formula." It completes the assignment of coordinate values in the slope formula. In this case we deal with x2 and y2. Teachers can walk students through this step by saying: "Now we complete the assignment of coordinate values into the slope formula. In this case we deal with x2 and y2. Do you see how those coordinates are highlighted in the formula?" |
Slope and Ratios and Rates |
|
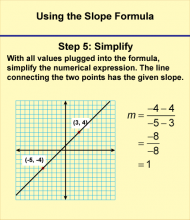
Math Clip Art--Linear Functions Concepts--Using the Slope Formula 6 | Math Clip Art--Linear Functions Concepts--Using the Slope Formula 6TopicLinear Functions DescriptionThis final image in the series focuses on Step 5 of using the slope formula: "Simplify." It shows how to express the calculated slope in its simplest form, if necessary. Teachers can conclude the lesson with this step by saying: "Our last step is to simplify our result if possible. Sometimes, our slope might be a fraction that can be reduced. Other times, it might already be in its simplest form. Why is it important to express our slope in the simplest possible way? How does this final step help us interpret what the slope means in the context of our line?" |
Slope and Ratios and Rates |
|
|
Math Clip Art--Linear Functions Concepts--Using the Slope Formula 6 | Math Clip Art--Linear Functions Concepts--Using the Slope Formula 6TopicLinear Functions DescriptionThis final image in the series focuses on Step 5 of using the slope formula: "Simplify." It shows how to express the calculated slope in its simplest form, if necessary. Teachers can conclude the lesson with this step by saying: "Our last step is to simplify our result if possible. Sometimes, our slope might be a fraction that can be reduced. Other times, it might already be in its simplest form. Why is it important to express our slope in the simplest possible way? How does this final step help us interpret what the slope means in the context of our line?" |
Slope and Ratios and Rates |

|
Math Clip Art: Images of Staircases | Use this selection of images to show steepness of stairs as a way of introducing the concept of slope. |
Slope |
|
|
Math Clip Art: Images of Staircases | Use this selection of images to show steepness of stairs as a way of introducing the concept of slope. |
Slope |
|
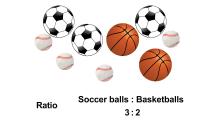
Math Clip Art: Slope vs. Rate | Math Clip Art: Slope vs. Rate In these clip art images, show students the difference between ratios and rates. These images are useful when talking about slope as both a ratio and a rate. In particular, this is useful when talking about slope as a rate of change. |
Slope and Ratios and Rates |
|
|
Math Clip Art: Slope vs. Rate | Math Clip Art: Slope vs. Rate In these clip art images, show students the difference between ratios and rates. These images are useful when talking about slope as both a ratio and a rate. In particular, this is useful when talking about slope as a rate of change. |
Slope and Ratios and Rates |

|
Math Clip Art: Slopes of Lines | Math Clip Art: Slopes of Lines Have students compare the slopes of the pairs of lines from these clip art images. Have them use the background grid for measuring the rise and the run. |
Slope |

|
Math Clip Art: Staircase Steepness | In this set of clip art images, different values for the rise and run are given, but in all cases they result in the same slope for the staircase. These images help advance the idea that slope is a ratio and proportion. |
Slope |
|
|
Math Clip Art: Staircase Steepness | In this set of clip art images, different values for the rise and run are given, but in all cases they result in the same slope for the staircase. These images help advance the idea that slope is a ratio and proportion. |
Slope |
|
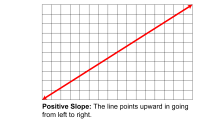
Math Clip Art: Types of Slope | Math Clip Art: Types of Slope Use these clip art images to show the different types of slope available. These slope types are covered: Positive SlopeNegative SlopeZero SlopeNo SlopeSlope = 1Slope =-10 < Slope < 1Slope > 1 |
Slope |
|
|
Math Clip Art: Types of Slope | Math Clip Art: Types of Slope Use these clip art images to show the different types of slope available. These slope types are covered: Positive SlopeNegative SlopeZero SlopeNo SlopeSlope = 1Slope =-10 < Slope < 1Slope > 1 |
Slope |