
Illustrative Math Alignment: Grade 8 Unit 3
Linear Relationships
Lesson 6: More Linear Relationships
Use the following Media4Math resources with this Illustrative Math lesson.
| Thumbnail Image | Title | Body | Curriculum Topic |
|---|---|---|---|
|
Lesson Plan--Linear Functions and Equations (MS)--Lesson 2--Graphing Linear Equations | Lesson Plan: Graphing Linear EquationsThis is the second lesson in a five-part series on linear equations. It introduces students to graphing linear equations using slope-intercept form: y=mx+b. Students will learn to identify slope and y-intercept, plot points, and interpret graphs in real-world contexts. The lesson aligns with Common Core Standards 8.EE.B.5 and 8.EE.B.6. |
Graphs of Linear Functions |
|
|
Lesson Plan--Linear Functions and Equations (MS)--Lesson 2--Graphing Linear Equations | Lesson Plan: Graphing Linear EquationsThis is the second lesson in a five-part series on linear equations. It introduces students to graphing linear equations using slope-intercept form: y=mx+b. Students will learn to identify slope and y-intercept, plot points, and interpret graphs in real-world contexts. The lesson aligns with Common Core Standards 8.EE.B.5 and 8.EE.B.6. |
Graphs of Linear Functions |

|
Lesson Plan--Linear Functions and Equations (MS)--Lesson 4--Linear Inequalities | Lesson Plan: Linear InequalitiesThis is the fourth lesson in a five-part series on linear equations and inequalities designed for middle school students. In this lesson, students explore the fundamentals of linear inequalities, including solving inequalities algebraically and graphing solution sets on the coordinate plane. Through step-by-step instruction, students learn to interpret inequality symbols, apply inverse operations, and determine whether to use solid or dashed boundary lines in graphs. The lesson includes real-world applications, such as budgeting constraints, work-hour limits, and spending allowances, demonstrating how linear inequalities are used in everyday decision-making. Aligned with Common Core Standards 6.NS.C.7a, 6.EE.B.5, 8.EE.B.5, and 8.EE.C.7b, this lesson builds on students’ prior knowledge of linear equations while introducing a broader understanding of algebraic inequalities. |
Inequalities |
|
|
Lesson Plan--Linear Functions and Equations (MS)--Lesson 4--Linear Inequalities | Lesson Plan: Linear InequalitiesThis is the fourth lesson in a five-part series on linear equations and inequalities designed for middle school students. In this lesson, students explore the fundamentals of linear inequalities, including solving inequalities algebraically and graphing solution sets on the coordinate plane. Through step-by-step instruction, students learn to interpret inequality symbols, apply inverse operations, and determine whether to use solid or dashed boundary lines in graphs. The lesson includes real-world applications, such as budgeting constraints, work-hour limits, and spending allowances, demonstrating how linear inequalities are used in everyday decision-making. Aligned with Common Core Standards 6.NS.C.7a, 6.EE.B.5, 8.EE.B.5, and 8.EE.C.7b, this lesson builds on students’ prior knowledge of linear equations while introducing a broader understanding of algebraic inequalities. |
Inequalities |

|
Lesson Plan--Ratios, Proportions, and Percents (Gr 8)--Lesson 3--Graphing and Interpreting Proportional Relationships | Lesson Plan: Graphing and Interpreting Proportional Relationships In this lesson, students will explore how to represent and analyze proportional relationships using graphs, tables, and equations. They will learn that proportional relationships follow the equation y=kx, where k is the constant of proportionality, and that these relationships always form a straight line passing through the origin on a coordinate plane. Key concepts covered in this lesson include: |
Applications of Ratios, Proportions, and Percents and Proportions |
|
|
Lesson Plan--Ratios, Proportions, and Percents (Gr 8)--Lesson 3--Graphing and Interpreting Proportional Relationships | Lesson Plan: Graphing and Interpreting Proportional Relationships In this lesson, students will explore how to represent and analyze proportional relationships using graphs, tables, and equations. They will learn that proportional relationships follow the equation y=kx, where k is the constant of proportionality, and that these relationships always form a straight line passing through the origin on a coordinate plane. Key concepts covered in this lesson include: |
Applications of Ratios, Proportions, and Percents and Proportions |

|
Lesson Plan--Ratios, Proportions, and Percents (Gr 8)--Lesson 4--Understanding Direct Variation and Its Connection to Proportional Relationships | Lesson Plan: Direct Variations In this lesson, students will explore direct variation, a special type of proportional relationship where one variable is a constant multiple of another. They will learn how to identify direct variation in tables, graphs, and equations, determine the constant of variation (k), and understand how direct variation relates to linear functions. Key concepts covered in this lesson include: |
Applications of Linear Functions and Applications of Ratios, Proportions, and Percents |

|
Lesson Plan--Ratios, Proportions, and Percents (Gr 8)--Lesson 5--Analyzing and Comparing Linear Relationships, Including Parallel and Perpendicular Lines | Lesson Plan: Parallel and Perpendicular Lines In this lesson, students explore the properties of parallel and perpendicular lines in coordinate geometry. They will learn how to identify these lines based on their slopes, determine equations for parallel and perpendicular lines, and apply these concepts to solve real-world and mathematical problems. Key concepts covered in this lesson include: |
Graphs of Linear Functions |
|
|
Lesson Plan--Ratios, Proportions, and Percents (Gr 8)--Lesson 5--Analyzing and Comparing Linear Relationships, Including Parallel and Perpendicular Lines | Lesson Plan: Parallel and Perpendicular Lines In this lesson, students explore the properties of parallel and perpendicular lines in coordinate geometry. They will learn how to identify these lines based on their slopes, determine equations for parallel and perpendicular lines, and apply these concepts to solve real-world and mathematical problems. Key concepts covered in this lesson include: |
Graphs of Linear Functions |

|
Lesson Plan--Slope Concepts--Lesson 1--What Is Slope? | Lesson Plan: What Is Slope? This lesson is the first in a six-part series designed to introduce middle school students to the concept of slope. Through interactive digital resources from Media4Math, students will explore how slope represents the ratio of vertical change to horizontal change between two points on a line. Key learning objectives include: Defining slope as a ratio of rise over run.Interpreting slope in real-world scenarios, such as staircases and ramps.Calculating slope using coordinate points on a graph.The lesson includes engaging digital media, practice problems, and guided activities to help students develop a strong conceptual understanding. This resource is aligned with educational standards, making it an essential part of any middle school math curriculum. Subscribers to Media4Math can download PDF versions of the lesson plan for easy classroom use. |
Slope |
|
|
Lesson Plan--Slope Concepts--Lesson 1--What Is Slope? | Lesson Plan: What Is Slope? This lesson is the first in a six-part series designed to introduce middle school students to the concept of slope. Through interactive digital resources from Media4Math, students will explore how slope represents the ratio of vertical change to horizontal change between two points on a line. Key learning objectives include: Defining slope as a ratio of rise over run.Interpreting slope in real-world scenarios, such as staircases and ramps.Calculating slope using coordinate points on a graph.The lesson includes engaging digital media, practice problems, and guided activities to help students develop a strong conceptual understanding. This resource is aligned with educational standards, making it an essential part of any middle school math curriculum. Subscribers to Media4Math can download PDF versions of the lesson plan for easy classroom use. |
Slope |

|
Lesson Plan--Slope Concepts--Lesson 2--Slope and Similar Triangles | Lesson Plan: Slope and Similar Triangles This lesson is the second installment in Media4Math's comprehensive six-part series on understanding slope in mathematics. It explores the relationship between slope and similar triangles, providing students with a geometric perspective on why the slope between any two distinct points on a non-vertical line remains constant. |
Slope |
|
|
Lesson Plan--Slope Concepts--Lesson 2--Slope and Similar Triangles | Lesson Plan: Slope and Similar Triangles This lesson is the second installment in Media4Math's comprehensive six-part series on understanding slope in mathematics. It explores the relationship between slope and similar triangles, providing students with a geometric perspective on why the slope between any two distinct points on a non-vertical line remains constant. |
Slope |

|
Lesson Plan--Slope Concepts--Lesson 3--Visualizing Slope | Lesson Plan: Visualizing Slope on a Graph This lesson is the third installment in Media4Math's comprehensive six-part series on understanding slope in mathematics. It focuses on helping students visualize and comprehend slope by engaging in hands-on activities that involve plotting points on a coordinate plane and analyzing the resulting lines. |
Slope |
|
|
Lesson Plan--Slope Concepts--Lesson 3--Visualizing Slope | Lesson Plan: Visualizing Slope on a Graph This lesson is the third installment in Media4Math's comprehensive six-part series on understanding slope in mathematics. It focuses on helping students visualize and comprehend slope by engaging in hands-on activities that involve plotting points on a coordinate plane and analyzing the resulting lines. |
Slope |

|
Lesson Plan--Slope Concepts--Lesson 4--Types of Slope | Lesson Plan: Types of Slope This lesson is the fourth installment in Media4Math's comprehensive six-part series on understanding slope in mathematics. It focuses on helping students differentiate among the four types of slope: positive, negative, zero, and undefined. Through interactive activities and visual aids, students will analyze how each type of slope affects the direction of a line on a graph. |
Slope |
|
|
Lesson Plan--Slope Concepts--Lesson 4--Types of Slope | Lesson Plan: Types of Slope This lesson is the fourth installment in Media4Math's comprehensive six-part series on understanding slope in mathematics. It focuses on helping students differentiate among the four types of slope: positive, negative, zero, and undefined. Through interactive activities and visual aids, students will analyze how each type of slope affects the direction of a line on a graph. |
Slope |

|
Lesson Plan--Slope Concepts--Lesson 5--The Slope Formula | Lesson Plan: The Slope Formula This lesson is the fifth installment in Media4Math's comprehensive six-part series on understanding slope in mathematics. It introduces students to the slope formula, a fundamental tool in algebra for determining the steepness and direction of a line between two points on a coordinate plane. |
Slope |
|
|
Lesson Plan--Slope Concepts--Lesson 5--The Slope Formula | Lesson Plan: The Slope Formula This lesson is the fifth installment in Media4Math's comprehensive six-part series on understanding slope in mathematics. It introduces students to the slope formula, a fundamental tool in algebra for determining the steepness and direction of a line between two points on a coordinate plane. |
Slope |

|
Lesson Plan--Slope Concepts--Lesson 6--Slope as Rate of Change | Lesson Plan: Slope as Rate of Change This lesson is the sixth and final installment in Media4Math's comprehensive six-part series on understanding slope in mathematics. It focuses on interpreting slope as a rate of change between two quantities, enabling students to apply this concept to real-world scenarios and mathematical problems. |
Slope |
|
|
Lesson Plan--Slope Concepts--Lesson 6--Slope as Rate of Change | Lesson Plan: Slope as Rate of Change This lesson is the sixth and final installment in Media4Math's comprehensive six-part series on understanding slope in mathematics. It focuses on interpreting slope as a rate of change between two quantities, enabling students to apply this concept to real-world scenarios and mathematical problems. |
Slope |
|
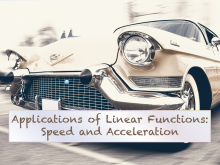
Math Clip Art--Applications of Linear and Quadratic Functions: Speed and Acceleration 01 | Math Clip Art--Applications of Linear and Quadratic Functions: Speed and Acceleration 01TopicQuadratics DescriptionThis image features a vintage car in motion with a blurred background, emphasizing speed. It serves as an introduction to the series on speed and acceleration in linear and quadratic functions. The image visually represents the concept of speed through motion blur, making it relatable for students learning about linear functions. By using this image, teachers can engage students with real-world applications of mathematical concepts. |
Graphs of Linear Functions and Graphs of Quadratic Functions |
|
|
Math Clip Art--Applications of Linear and Quadratic Functions: Speed and Acceleration 01 | Math Clip Art--Applications of Linear and Quadratic Functions: Speed and Acceleration 01TopicQuadratics DescriptionThis image features a vintage car in motion with a blurred background, emphasizing speed. It serves as an introduction to the series on speed and acceleration in linear and quadratic functions. The image visually represents the concept of speed through motion blur, making it relatable for students learning about linear functions. By using this image, teachers can engage students with real-world applications of mathematical concepts. |
Graphs of Linear Functions and Graphs of Quadratic Functions |

|
Math Clip Art--Applications of Linear and Quadratic Functions: Speed and Acceleration 02 | Math Clip Art--Applications of Linear and Quadratic Functions: Speed and Acceleration 02TopicQuadratics DescriptionThis image depicts a yellow car alongside a table that shows time in seconds and distance in feet, illustrating a constant speed of 88 ft/sec (60 mph). The table provides a clear example of how linear functions can represent constant speeds. Teachers can use this image to demonstrate the relationship between time, distance, and speed, reinforcing the concept of constant rates within linear functions. |
Graphs of Linear Functions and Graphs of Quadratic Functions |
|
|
Math Clip Art--Applications of Linear and Quadratic Functions: Speed and Acceleration 02 | Math Clip Art--Applications of Linear and Quadratic Functions: Speed and Acceleration 02TopicQuadratics DescriptionThis image depicts a yellow car alongside a table that shows time in seconds and distance in feet, illustrating a constant speed of 88 ft/sec (60 mph). The table provides a clear example of how linear functions can represent constant speeds. Teachers can use this image to demonstrate the relationship between time, distance, and speed, reinforcing the concept of constant rates within linear functions. |
Graphs of Linear Functions and Graphs of Quadratic Functions |
|
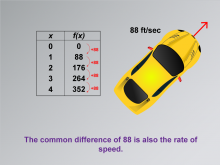
Math Clip Art--Applications of Linear and Quadratic Functions: Speed and Acceleration 03 | Math Clip Art--Applications of Linear and Quadratic Functions: Speed and Acceleration 03TopicQuadratics DescriptionThis image is a variation of the previous image that highlights the common difference as the rate of speed. It builds on the previous example by emphasizing how the common difference (88 ft/sec) serves as the rate in linear equations. This visual representation helps students grasp how mathematical differences translate into real-world speeds. |
Graphs of Linear Functions and Graphs of Quadratic Functions |
|
|
Math Clip Art--Applications of Linear and Quadratic Functions: Speed and Acceleration 03 | Math Clip Art--Applications of Linear and Quadratic Functions: Speed and Acceleration 03TopicQuadratics DescriptionThis image is a variation of the previous image that highlights the common difference as the rate of speed. It builds on the previous example by emphasizing how the common difference (88 ft/sec) serves as the rate in linear equations. This visual representation helps students grasp how mathematical differences translate into real-world speeds. |
Graphs of Linear Functions and Graphs of Quadratic Functions |
|
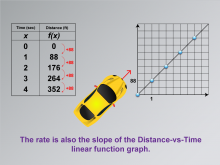
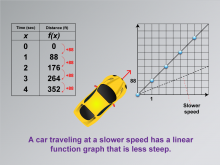
Math Clip Art--Applications of Linear and Quadratic Functions: Speed and Acceleration 04 | Math Clip Art--Applications of Linear and Quadratic Functions: Speed and Acceleration 04TopicQuadratics DescriptionThis image presents a table with time in seconds and distance in feet, accompanied by a graph illustrating a linear relationship between time and distance. The constant increase of 88 feet per second is depicted as the slope of the Distance-vs-Time linear function graph. This visual aids students in understanding how linear functions can model real-world speed scenarios. |
Graphs of Linear Functions and Graphs of Quadratic Functions |
|
|
Math Clip Art--Applications of Linear and Quadratic Functions: Speed and Acceleration 04 | Math Clip Art--Applications of Linear and Quadratic Functions: Speed and Acceleration 04TopicQuadratics DescriptionThis image presents a table with time in seconds and distance in feet, accompanied by a graph illustrating a linear relationship between time and distance. The constant increase of 88 feet per second is depicted as the slope of the Distance-vs-Time linear function graph. This visual aids students in understanding how linear functions can model real-world speed scenarios. |
Graphs of Linear Functions and Graphs of Quadratic Functions |
|
Math Clip Art--Applications of Linear and Quadratic Functions: Speed and Acceleration 05 | Math Clip Art--Applications of Linear and Quadratic Functions: Speed and Acceleration 05TopicQuadratics DescriptionThis image is a variation showing time and distance data with a graph that includes a dotted line labeled "Slower speed." The graph illustrates how different speeds affect the steepness of linear function graphs. This visual comparison helps students see how speed variations are represented mathematically. Using math clip art allows students to visualize differences in speed through graphical representations, aiding comprehension of linear functions' applications. |
Graphs of Linear Functions and Graphs of Quadratic Functions |
|
|
Math Clip Art--Applications of Linear and Quadratic Functions: Speed and Acceleration 05 | Math Clip Art--Applications of Linear and Quadratic Functions: Speed and Acceleration 05TopicQuadratics DescriptionThis image is a variation showing time and distance data with a graph that includes a dotted line labeled "Slower speed." The graph illustrates how different speeds affect the steepness of linear function graphs. This visual comparison helps students see how speed variations are represented mathematically. Using math clip art allows students to visualize differences in speed through graphical representations, aiding comprehension of linear functions' applications. |
Graphs of Linear Functions and Graphs of Quadratic Functions |
|
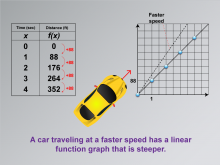
Math Clip Art--Applications of Linear and Quadratic Functions: Speed and Acceleration 06 | Math Clip Art--Applications of Linear and Quadratic Functions: Speed and Acceleration 06TopicQuadratics DescriptionThis image shows a graph similar to the previous one but with a steeper dotted line labeled "Faster speed." It visually demonstrates how increased speed results in a steeper slope on a linear function graph. This helps students understand the relationship between speed changes and their graphical representations. The use of math clip art facilitates learning by providing clear visual examples that connect mathematical concepts to real-world scenarios. |
Graphs of Linear Functions and Graphs of Quadratic Functions |
|
|
Math Clip Art--Applications of Linear and Quadratic Functions: Speed and Acceleration 06 | Math Clip Art--Applications of Linear and Quadratic Functions: Speed and Acceleration 06TopicQuadratics DescriptionThis image shows a graph similar to the previous one but with a steeper dotted line labeled "Faster speed." It visually demonstrates how increased speed results in a steeper slope on a linear function graph. This helps students understand the relationship between speed changes and their graphical representations. The use of math clip art facilitates learning by providing clear visual examples that connect mathematical concepts to real-world scenarios. |
Graphs of Linear Functions and Graphs of Quadratic Functions |
|
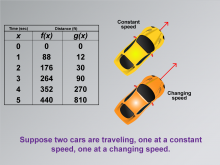
Math Clip Art--Applications of Linear and Quadratic Functions: Speed and Acceleration 07 | Math Clip Art--Applications of Linear and Quadratic Functions: Speed and Acceleration 07TopicQuadratics DescriptionThis image displays a table with time and distance data for two functions, f(x) representing constant speed, and g(x) representing changing speed. Two car icons illustrate these concepts visually. This comparison allows students to explore how different types of motion are modeled mathematically. The use of math clip art aids in understanding complex concepts by providing relatable visual examples that highlight differences in mathematical functions. |
Graphs of Linear Functions and Graphs of Quadratic Functions |
|
|
Math Clip Art--Applications of Linear and Quadratic Functions: Speed and Acceleration 07 | Math Clip Art--Applications of Linear and Quadratic Functions: Speed and Acceleration 07TopicQuadratics DescriptionThis image displays a table with time and distance data for two functions, f(x) representing constant speed, and g(x) representing changing speed. Two car icons illustrate these concepts visually. This comparison allows students to explore how different types of motion are modeled mathematically. The use of math clip art aids in understanding complex concepts by providing relatable visual examples that highlight differences in mathematical functions. |
Graphs of Linear Functions and Graphs of Quadratic Functions |
|
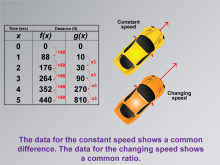
Math Clip Art--Applications of Linear and Quadratic Functions: Speed and Acceleration 08 | Math Clip Art--Applications of Linear and Quadratic Functions: Speed and Acceleration 08TopicQuadratics DescriptionThis image presents time-distance data for functions f(x) with constant increments, showing constant speed, while g(x) shows changing speed with a common ratio. The visual representation helps students understand different mathematical relationships through real-world examples. The use of math clip art enhances comprehension by clearly illustrating abstract concepts like common differences versus common ratios in mathematical functions. |
Graphs of Linear Functions and Graphs of Quadratic Functions |
|
|
Math Clip Art--Applications of Linear and Quadratic Functions: Speed and Acceleration 08 | Math Clip Art--Applications of Linear and Quadratic Functions: Speed and Acceleration 08TopicQuadratics DescriptionThis image presents time-distance data for functions f(x) with constant increments, showing constant speed, while g(x) shows changing speed with a common ratio. The visual representation helps students understand different mathematical relationships through real-world examples. The use of math clip art enhances comprehension by clearly illustrating abstract concepts like common differences versus common ratios in mathematical functions. |
Graphs of Linear Functions and Graphs of Quadratic Functions |